Dow Jones Utilities
Market Odds For The Second Half
.jpg?fit=fillmax&w=222&bg=FFFFFF)
With the halfway point of 2023 two weeks away, the S&P 500 has broken out to a 12-month high. The index has accomplished that feat 32 times during the month of June—or exactly one-third of all cases measured back to 1928.
The Trend Is A Bit Less Friendly
The MTI’s move to its Negative zone with the October 1st reading was driven by a few trend breakdowns—ones that could well reverse in short order. Recognizing the volatility of these signals (and perhaps having been “conditioned” by the one-way market of the last 18 months), we opted for just a minor asset allocation adjustment.
Not The Leader We Wanted??
If many of the typical leaders of a new bull market aren’t leading, what is? Technology, obviously—and the bigger, the better.
“Don’t Just Do Something, Stand There!”
Inaction has been a richly rewarded trait throughout the current bull market, and especially in 2017.
Stock Market Observations
We remain bullish on stocks but with very limited visibility into 2018.
Bonds, Breadth, And Leadership: A Simple Model

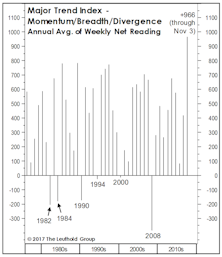
Hard-core statisticians might be disappointed to learn that the 140-ish inputs in our Major Trend Index (MTI)aren’t entirely “independent and uncorrelated.”
Is The Crack In Utilities A Broader Market Warning?
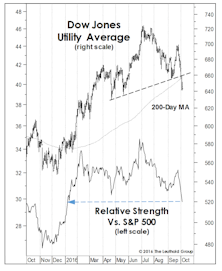
A few months ago, we mentioned the valuation risks that had built up in the stodgy Utilities sector, which at its mid-summer peak commanded a trailing P/E multiple of 24x—almost 10 points above its 1990-to-date median of 14.7x.
“Four On The Floor”
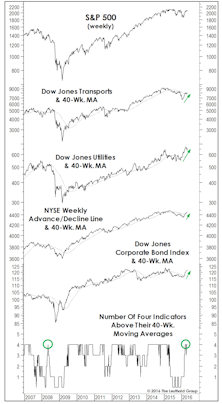
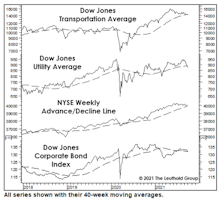
Leadership, breadth, and corporate credit all staged intermediate-term breakouts, rising above their respective 40-week moving averages. In this formation, historically, S&P 500 annualized return is +15%.
Weakening Foundation
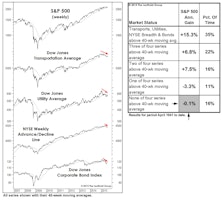
Over the last few months, we’ve presented a couple of simple quantitative studies meant to encapsulate the factors driving our Major Trend Index to the brink of bear territory. The chart and table might provide the best summary yet.
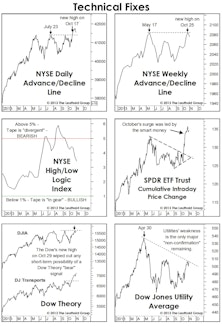
A BUY Signal That Says SELL?
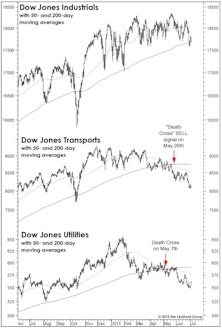
Last month we discussed the negative market implications of May’s “Death Cross” signals in the Dow Transports and Dow Utilities.
The Double Death Cross!

The Dow Transports and Dow Utilities both triggered major sell signals in May when their 50-day moving averages fell below their 200-day moving averages… known by some as a “Death Cross.”
Little To Complain About
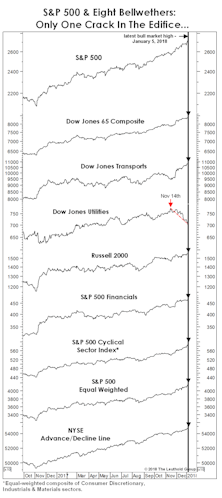
From a pure price action perspective, it’s difficult to find cracks in the bull market’s edifice.
Breadth & Leadership: Bull Markets Rarely (S)Top On A Dime
Market breadth moved down in tandem with stock market indices, but is not showing any divergences. All advance/decline lines were making new highs just before the downturn, and bull markets do not end with advance/decline data posting new highs.
Perception for the Professional
March 2026 Issue

Featured Articles
Sector Navigator
March 2026 Issue
