Dreams
Industry Group Dreams And Nightmares

The “Dreams” portfolio represents a simple industry group trend-following approach, while the “Nightmares” portfolio serves as a bottom-fishing strategy made up of the previous year’s biggest losers.
Industry Group Dreams And Nightmares

For nearly three decades The Leuthold Group has tracked hypothetical portfolios composed of the previous year’s industry group “Dreams” and “Nightmares.”
2016’s Industry Group Dream & Nightmare Portfolios

For nearly three decades The Leuthold Group has tracked its hypothetical industry group portfolios composed of the previous year’s “Dreams” (best performers) and “Nightmares” (worst performers).
Annual Industry Group Dreams & Nightmares

A review of the past year’s performance of “Dream” and “Nightmare” equity groups from back in 2014.
Industry Group Dreams And Nightmares
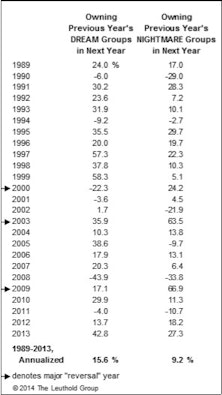
For more than a quarter century, The Leuthold Group has tracked hypothetical industry group portfolios composed of the previous year’s “Dreams” (best performers) and “Nightmares” (worst performers). The former is a gauge of a simple, trend-following investment strategy, while the latter is a crude form of industry group “bottom-fishing.” Sticking with tradition, the following pages detail how the 2013 Dream and Nightmare portfolios faired in 2014, and we reveal which industries qualify in the Dream and Nightmare portfolios of 2014.
The Dreams & Nightmares Of 2013
For 25 years we’ve tracked hypothetical industry group portfolios comprised of the previous year’s “Dreams” (20 best performers) and “Nightmares” (20 worst performers).

Group Trends of 2010 Persist In 2011—Somewhat

How did 2010’s “Dreams” and “Nightmares” pan out in 2011? What are 2011’s hypothetical portfolios predicting for 2012?
Dreams Of What Could Have Been

Doug Ramsey previews the 2011 hypothetical “Dream Portfolio” (or perhaps, “fear” portfolio). What would the portfolio manager with perfect foresight owned at the beginning of 2011? Should one now begin or continue to invest in the components of the Dream Portfolio?
Dreams, Nightmares & Bridesmaids: Should You Hold On To Last Year’s Winners?

Of Special Interest asks “Should You Hold On To Last Year’s Winners?” by examining the Dreams, Nightmares and Bridesmaid strategies. This year, our analysis expands beyond equity groups to the sector and asset class levels.
2009 Dreams And Nightmares...A Look Back At What Might Have Been
Based on loud bearish complaints about the “junk rally”—and our commentary on the Revenge-of-the-Nerds (anti-momentum) effect—it should come as no surprise that 2009 marked the most dramatic reversal of industry leadership we have seen in our twenty-plus years of tracking this work.
2008 Dreams And Nightmares...A Look Back At What Might Have Been

Even with perfect hindsight, an investor who purchased the 20 best performing groups in 2008 would have generated a 13% loss for the year. The 20 worst performing groups had an average loss of 62.5%.
A Look In The Rearview Mirror

2007’s “Good, Bad, and Ugly” of The Leuthold Group research; Leuthold Group Selection (GS) Scores performance review; Weighted index vs. Un-Weighted index performance; and 2007’s “Dreams & Nightmares” portfolios.
2006 Dreams And Nightmares...A Look Back At What Might Have Been

A look back at the performance one would have achieved by investing in the year’s best groups and the pain felt from investing in the worst performing groups in 2006. We also examine the strategy of buying a prior year’s winners and losers in anticipation of better performance the following year.
2005 Dreams And Nightmares

The year’s best and worst performing groups. Buying 2004 big winners produced good 2005 performance. How will 2005 winners do in 2006?
2004 Dreams And Nightmares… A Look At What Might Have Been

It would have been a successful strategy to buy the 20 worst sectors from 2003 at the start of 2004.
2003 Dreams And Nightmares… A Look At What Might Have Been

This month’s “Dreams & Nightmares” shows the best and worst performing equity groups in 2003. Be careful about buying 2003’s big winners. A better strategy can be achieved by buying the year’s biggest losers.
2002 Dreams And Nightmares….A Look At What Might Have Been

An examination is made of the previous year’s leaders and laggards to see if success could have been attained by buying last years big winners (or the big losers).
2001 Dreams & Nightmares… A Look At What Might Have Been

Per client request, we examine 2001 portfolio early, in order to preview the year’s winners and losers.
Dreams & Nightmares: Mid Year Update

Mid-year update how an investor would have done if they had been fortunate enough to invest in the 20 best performing industry groups (and visa versa).
2000 Dreams and Nightmares

A look at “what might have been”.
1999 Dreams and Nightmares… A Look At What Might Have Been

One would not expect to generate better than average returns by chasing last year’s big winners. But this simplistic approach did produce better than average results in 1999, as it usually has over the last eleven years.
1997 Dreams And Nightmares...Minimal Metamorphosis
Each January, this publication has presented a look back at the prior year’s best and worst industry groups and institutional stocks.
1995 Dreams and Nightmares...A Look at What Might Have Been

With perfect hindsight, one could have produced a gain of almost 70% by investing in 1995’s 25 biggest institutional stock winners.
1994 Dreams And Nightmares-A Look At What Might Have Been
Among institutional favorite type stocks, the Dream Individual Stock Portfolio was up 23.6%, while the Nightmare Portfolio was down 20.7%
Dreams and Nightmares - A Look at What Might Have Ben

In 1993, it surprisingly paid off to stick with last year's big winners and avoid 1992's big losers.
Dreams And Nightmares
Much of the January Green Book is devoted to tradition, so too is this section.
Dreams And Nightmares
Much of the January Green Book is devoted to tradition, so too is this section. We resumed this tradition two years ago and have found it to be quite interesting. We now annually conduct this exercise each January, examining the previous year's leading and lagging stock market groups.
Dreams And Nightmares
Last year, we resumed a tradition started a number of years ago.
Dreams And Nightmares
For a number of years we conducted an annual exercise each January, examining the previous year's leading and lagging stock market groups.
Dreams & Nightmares

1984's Institutional "dream" portfolio made up of the twenty best performing large cap stock groups was up 20% (excluding dividends) while the aggressive "dream" portfolio was up 33%. The "nightmare" portfolio, constructed of the twenty worst groups was down 49%. See? Things could have been worse…
Dreams & Nightmares

Each January we present for the preceding year what would have been, from a group standpoint, the perfect portfolios (Institutional and Aggressive). In 1983 the dream Institutional portfolio was up 56%, the Aggressive up 70%. The worst possible portfolio for 1983 was down 18%. Take a look and see where you should have and shouldn’t have been.
1982’s “Dream” and “Nightmare” Portfolios

If your stock group analysis was flawless, a 1982 gain of 85% was possible, even beating Phil Hempleman. If it was hopeless, a loss of 41% was possible. This annual feature had some weird twists this time.
1981’s Dreams and Nightmares

Does it pay to buy last year’s winners? Not usually. 1981’s best and worst performers reviewed, with an update of what happened to 1980’s best and worst in 1981.
Perception for the Professional
March 2026 Issue

Featured Articles
Sector Navigator
March 2026 Issue
