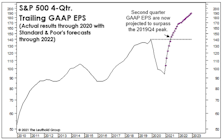
Forward EPS
In The “Eye” Of The Beholder

Stocks could trade higher in the next few months as CPI numbers enjoy easy year-to-year comparisons, prompting a more soothing tone in daily Fed-speak. Then again, the lagged impact of the last year’s rate hikes and balance-sheet shrinkage has yet to materialize, meaning we’re likely in the eye of the storm.
“PSsss”
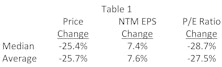
The most brutal bear markets occur when falling earnings are accompanied by shrinking valuations, producing a compound negative effect on stock prices. Investors in 2022 have (so far) avoided this double-whammy in that valuations have taken a hit, but EPS estimates are holding strong. We are intrigued by the notion that 2022’s bear market has, to date, been all about valuation compression rather than earnings weakness. Investors are coping with the problems of the day by letting the air out of bubbly valuations, and this report takes a closer look at the valuation squeeze underlying the current selloff.
Research Preview: P/E Multiple Compression In 2022
Stock market corrections are the result of falling valuations and/or falling earnings, and when both conditions appear together, investors are in for a rough ride. Thus far, the 2022 selloff has been confined to compressing P/E ratios, and we launched a research project to take a closer look at shrinking stock valuations in this market downdraft.
Hello To The Roaring Thirties?!
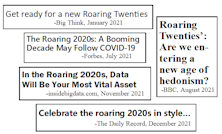
The ink hadn’t dried on 2020’s PPP checks when pundits began speculating that the new decade could be a repeat of last century’s “Roaring Twenties.” That’s become a popular view after a booming 5.7% real GDP growth and a nearly 30% stock market gain in 2021. Just how popular? Analysts are already extrapolating their bullish views into the 2030s!
Party Like It’s 2029?
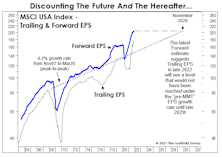
Trailing EPS that the Street now expects for the twelve months ending November 2022 would not have been achieved until November 2029 if the pre-COVID trend-line EPS growth rate had remained intact throughout the current decade.
Our Annual Lament On Foreign Equities
There should be a name for the syndrome suffered by foreign stock investors over the last decade or so. “Groundhog Day” doesn’t quite cut it, because that event repeats only once a year. It seems like this time of year we always feature a chart showing a healthy YTD double-digit gain in the S&P 500, along with a bond-like gain in EAFE, and a bond-like gain or loss in the MSCI Emerging Markets Index.
How It All Went “Down”
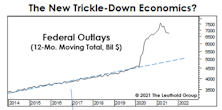
The COVID rescue plan has generated a multi-trillion-dollar deluge of federal spending that has trickled down to government transfer payments, personal incomes, retail sales, and surging EPS. When considering all of these data series in relation to their long-term trends, it’s truly remarkable that the only item analysts consider to be “transitory” is inflation.
“Provincialism” Pays
After the last two months’ violent reversal of the “re-opening” trade, the major indexes for U.S. Large Cap, Small Cap, Growth, and Value all stood with YTD gains in the 14-16% range. Yes, a few nimble portfolio managers might have migrated out of “re-opening” stocks in early April and into the “old” Large Cap Growth leadership but the surest route to superior performance has been to avoid what’s become an almost annual pitfall since the Great Financial Crisis: Foreign stocks. EAFE and MSCI Emerging Markets already trail the S&P 500’s 16.0% YTD gain by about 8% and 12%, respectively.
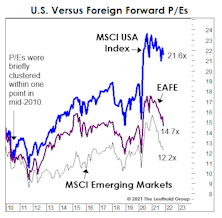
Visualizing U.S. Stock Market Dominance
.jpg?fit=fillmax&w=222&bg=FFFFFF)
It’s near the year’s mid-point and U.S. equities are doing what they’ve done nearly every year since the onset of the Great Financial Crisis: trouncing their foreign counterparts. The S&P 500’s YTD gain of 13.5% is about 500 basis points better than EAFE’s, and 800 basis points above that of the MSCI Emerging Markets Index.
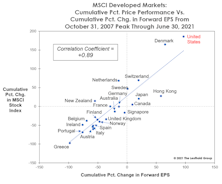
The Global EPS Rebound
For years, we’ve noted the increasing valuation gap between domestic and foreign stocks. And for years, we contended that the most likely catalyst for a narrowing of that gap would be a recession-induced cyclical bear market in stocks. Evidently the 2020 bear market was not big enough to do the job.
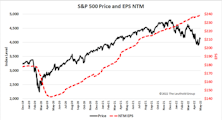
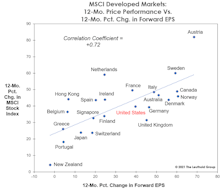
Sizing Up The Profit Recovery
We don’t make much use of “Forward” EPS for the S&P 500 because analyst forecasts have tended to be hopelessly optimistic. But if their short-term projections are on target, when numbers for the current quarter are reported, 12-month trailing GAAP EPS will exceed the $139.47 pre-COVID peak.
What’s Embedded In The Consensus?
.jpg?fit=fillmax&w=222&bg=FFFFFF)
Market momentum now seems to outweigh simple math in the minds of most investors, and we are not entirely immune. Today our tactical funds are positioned with net equity exposure of 50%, the midpoint of the normal 30-70% range. That’s a higher allocation than if we considered only business cycle dynamics and equity valuations.
Perception for the Professional
March 2026 Issue

Featured Articles
Sector Navigator
March 2026 Issue
