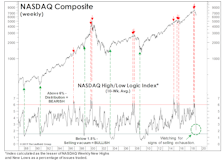
High/Low Logic Index
A Morsel For The Bulls
The MTI’s Technical category is still decisively negative at -3, but some of its shorter-term “counter-trend” components look intriguing for the first time in 2022’s entire decline. In particular, we’re watching the behavior of a group of indicators that performed brilliantly near the bull market highs.
What Will A Low “Look Like?”

We think it’s much too early to be looking for a major bottom in stock prices, but it’s worth reviewing some of the signals that will help confirm such a low is at hand.
Not Dot-Com
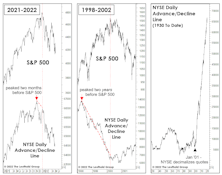
Bulls have been quick to assure us that this market “bears” no resemblance to the dot-com bust. We agree—but probably for very different reasons. Among them are the conventional breadth measures, which provided little warning of this year’s January peak. And, the initial decline off January’s top has been much broader than during the first phase of the dot-com bust.
Portraits Of A Split Market
.jpg?fit=fillmax&w=222&bg=FFFFFF)
There’s an old Wall Street adage: “When the wind blows hard enough, even the turkeys fly.” A sophisticated meteorological instrument known as the “price chart” says the wind died down considerably beginning in January 2018
“Granddaddy” Tells A Lie

Based on the “granddaddy” of all technical indicators—the daily advance/decline line—we wouldn’t normally be worried that the April 30th high in the S&P 500 could be the final high of the bull market.
Are New Lows The Key To New Highs?

Last year’s market decline was one of the largest to have occurred without a lengthy-preceding period in which breadth narrowed and Small Caps significantly underperformed.
Watching For An Internal Washout
Having monitored market internals for warning signs for longer than we care to admit, it’s refreshing to turn around and watch many of the same signals for… wait for it... BUY signals!
Technical Difficulties
Traditional breadth measures have yet to show end-of-cycle thinning of the ranks, but some secondary measures suggest that process may be underway.
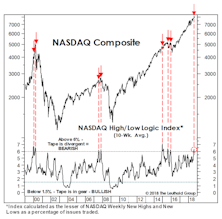
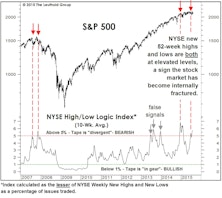
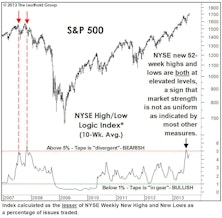
Why So Many Lows Near A New High?
.jpg?fit=fillmax&w=222&bg=FFFFFF)
The S&P 500 has closed within a half percent of an all-time high three times this week, and the S&P 1500 Composite did make such a high on Tuesday, August 21st...
Stock Market Observations
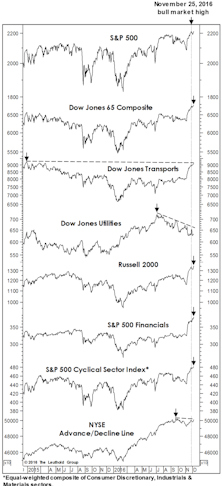
We revisit our “Red Flag Indicator” of prior bull market tops versus today. Usually most of these internal market measures will deteriorate in advance of the final bull market peak. At the latest S&P high, three of the seven leading measures had raised Red Flags, by not confirming, but two of them (DJ Transports and the NYSE A/D Line), are within just ticks of new bull market highs.
Internal Market Strife

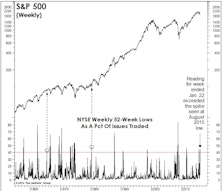
It’s not only the electorate that’s polarized in the wake of last week’s presidential vote: Internal disparities within the stock market over the last several days have been some of the most extreme we’ve ever observed. For example, on Monday, November 14th, NYSE Daily 52-Week New Highs and Lows both exceeded 10% of Issues Traded. There’s no day that’s been even remotely comparable in almost 75 years of NYSE history.
NYSE “New Lows” Figures Point To “Lower Lows”…
At the August and late January S&P 500 lows, both the Daily and Weekly NYSE New Lows figures exceeded 40% of Issues Traded —a degree of downside thrust rarely seen outside of bear markets.
The NYSE: A Timely Insider Sale
We tracked the “legal” insider actions of NYSE specialists for many years, until a crackdown on that business model early last decade rendered our old data sets virtually irrelevant.
Too Many Highs, Too Many Lows
We’ve detailed the growing degree of stock market bifurcation, but the problem for would-be bears is that such bifurcation can reach astonishing levels (witness 1999-2000) before the market is set to peak out.
Not Your Typical Bear Warnings...
With July’s market surge producing new cyclical highs in virtually every important subgroup (other than Utilities), it’s difficult—if not dangerous—to question the U.S. stock market’s technical underpinnings.
How Long Can This Go On?

Unless earnings begin to show strong signs of growth (not evident at present), the stock market is clearly still ahead of itself (even after the decline).
Perception for the Professional
March 2026 Issue

Featured Articles
Sector Navigator
March 2026 Issue
