Highs
Bull Pause, Or Bear Paws?
The old maxim says that when the bears have Thanksgiving, the bulls have Christmas.
New Highs In Stocks Have Some Unwanted Company
.jpg?fit=fillmax&w=222&bg=FFFFFF)
In recent commentaries, we’ve highlighted the surprising number of U.S. stocks making 52-week lows on both a daily and weekly basis, a sign that the market’s push higher has become more fractured. While pondering the significance of those lows, however, we missed a new 52-week high last Friday in a series we think will be especially critical to the stock market’s near-term fortunes: the 10-year U.S. Treasury bond yield. Specifically, the yield matched its weekly closing high of 3.07% posted on May 18th.
What A Strong “Tape” Does (And Doesn’t) Mean
Our disciplines remain bullish, but we periodically wonder whether we’re being too cavalier in keeping our tactical portfolios “almost” fully-invested (at 65% equities) in the face of valuations that are higher than those seen in all but perhaps 24 months of stock market history.
“Changes In Attitudes, Changes In Latitudes”
The above caption—and Jimmy Buffett song title—comes from the “View From The North Country” section in the first-ever Green Book published in November 1981. Not much has changed in 35 years.
Charts: Beware Of Myopia
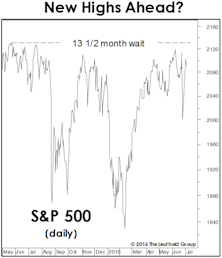
Despite a two-month stall in the blue chips, the breadth and momentum behind the market’s rally off mid-February lows remain hard to deny.
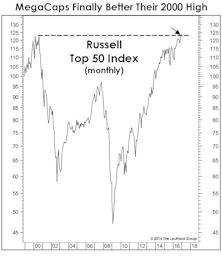
Too Many New Highs To Make A High?
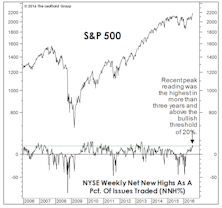
The number of NYSE 52-Week Highs typically peaks during the bull market’s strongest leg, before contracting into the final top. Last month, Net New Highs made a three-year high—implying more upside.
Stock Market Observations
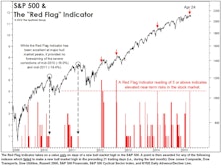
With the S&P 500 levitating near its all-time high, stock market leadership is peculiar—characterized by a flight to quality. And, despite the market’s violent bounce off February lows, there have been only four new market highs set by key indexes on our “Bull Market Top Timeline” table.
Strength + Weakness = Weakness?
We like to think our models and indicators help us preserve a high degree of market objectivity. But sometimes we wonder: the latest rally has progressed to the point where we see trouble afoot in both the strongest and weakest charts we can find.
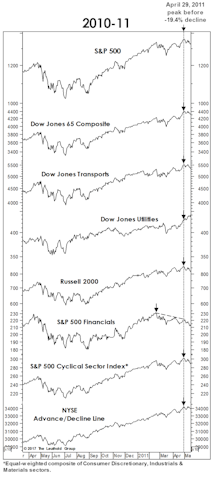
A Page For The Bulls
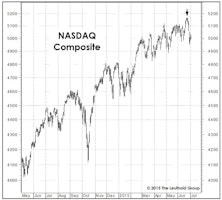
One could conceivably argue the market is still “cohesive” enough to hold together for awhile longer. June 23rd saw closing bull market highs in the NASDAQ, Mid Caps, Small Caps (both the S&P 600 and Russell 2000), and the critical KBW Bank and NYSE Arca Broker/Dealer Indexes.
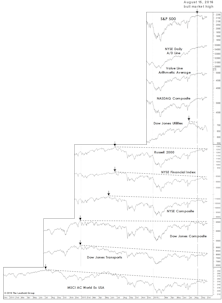
Two Takes On The Ticker Tape
Conventional breadth measures show the U.S. market to be healthy, with key indexes confirming the April 24th S&P 500 high. However, sector leadership is behaving in a way that’s consistent with an approaching market top.
Last Target Standing?
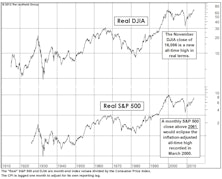
The inflation-adjusted all-time high for the S&P 500 is currently 2061, a figure we think will be just out of reach for 2014.
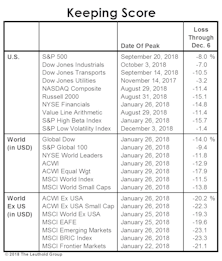
Market Internals: Today Vs. Past Peaks

The table below compares the status of today’s stock market “internals” versus those which existed at the onset of (1) the past four U.S. bear markets; and (2) the two severe corrections taking place within the current bull market. There’s good and bad news here.
Two Charts, A World Apart
Notwithstanding the opening days of June, U.S. stocks have shown remarkable strength considering the bull is now well into its fifth year.
Perception for the Professional
March 2026 Issue

Featured Articles
Sector Navigator
March 2026 Issue
