M2 Money Supply
Has The Tsunami Of Stimulus Been Worth It?
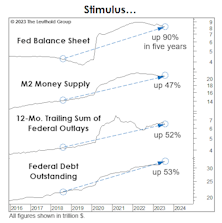
Federal outlays, federal debt, and M2 have each jumped ~50% in five years, while the Fed’s balance sheet soared by 90%. The “reward”: Real GDP cumulative growth per capita of 1.6% per year (a good chunk of which will be reversed during a recession).
Revisiting The 1966 Forecast Failure
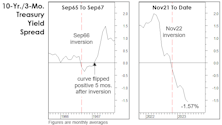
Developments over the last four months leave us even more skeptical that the November yield-curve inversion will join 1966 as a “false positive.” The number one reason being the subsequent shift in the yield curve itself.
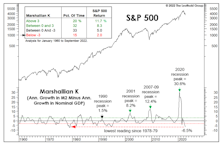
The “K” Has Been “KO’d”
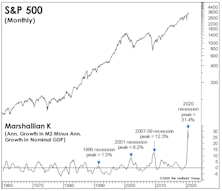
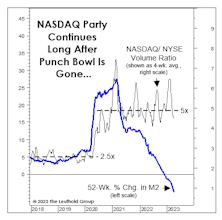
Volcker stormed to the scene to extinguish a blaze lit by others, while Powell battles a conflagration of his own making. Even if Powell executed a perfect, disinflationary soft landing, there may be something else in the cards: The magnitude of M2 shrinkage has resulted in the Marshallian K’s worst ever reading.
Illiquidity Rules The Day
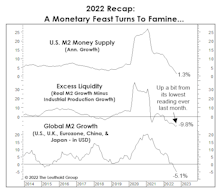
Nearly everyone would cite high inflation as the dominant theme of 2022. But we think that the evaporation of a one-time ocean of liquidity better explains the horrendous backdrop for stocks and bonds. High inflation sped up the rate of evaporation, but it was going to occur anyway.
Economy Soaking Up Scarce Money Supply
There might be “too much money chasing too few goods,” but some monetary measures imply there’s “no longer enough money” to finance production of those goods and still support a stock market that’s far from cheap.
Interrupting The Recession Debate With A Reminder Of How Hot The Economy Is
“Money illusion” continues to complicate analysis of the economy and financial markets. It might be a time when age and experience will actually prove helpful: Only investors who are 65 or older have experienced gaps between “nominal” and “real” data as wide as today’s.
Past Pivots Prompted By Politics
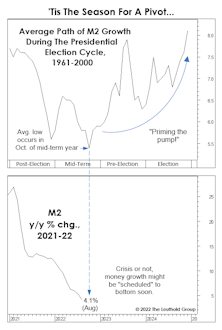
We scrutinized the typical path of money growth during the four-year presidential election cycle, and found that it typically tends to bottom out in October of the midterm year! The cycle says a monetary pivot is imminent, and the average pattern traced out by M2 suggests an acceleration in the growth rate of about 2.5% leading up to the presidential election.
More Signs Of Peak Inflation
As suggested in our June 24th, Chart of the Week, the peak in consumer inflation (+8.6% in May) has likely either occurred or is imminent. Consumers should thank the stock market, which in 2022 has taken up its occasional role as inflation-fighter after the Fed abdicated throughout 2021.
“Memes” Need Money Growth...
The extra months of QE “auto-pilot” failed to support some of the themes we’d have thought were the most likely to benefit from it—including IPOs, SPACs, Bitcoin, and the sky-high growers favored by the ARK Innovation ETF. Instead, the smart play with each of these assets was to ignore the ever-expanding Fed balance sheet and sell in February.
That Money Tsunami Is Now Just A Flood
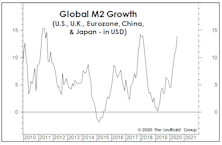
Compare the U.S. monetary response in early 2020 to China’s: The Fed quadrupled the M2 growth rate (from 6% to 24%) in three months, while China merely bumped M2 growth from 8% to 11%. This relative policy restraint leaves China in a better position to handle potential fallout than if it had gone “all in” like the U.S.
Liquidity: As Good As It Gets?
Stock market manias thrive on buzzwords, and if there’s a single one that captured the essence of the late 1990s’ boom it was “productivity.” In today’s version, our top candidate is “liquidity”—and we doubt anyone would argue.
Can Money Growth Trump All Else?
In 2019 and 2020, our regard for time-tested valuation tools resulted in tactical portfolios being underexposed to stocks during a pair of tremendous rallies. Now, the critique is that we don’t appreciate the brilliance of today’s policymakers and their miraculous ability to pivot just when the stocks (and, in the latest case, the economy) need it most.
The Money Supply Isn’t Magic
Imagine our surprise when the bullish stock market narrative is suddenly all about money. Cynically, though, that might be because money supply and the unemployment rate are the only economic data series staging upside breakouts, and the latter doesn’t lend itself to a good narrative.
Monetary Musings
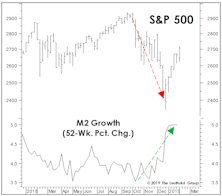
Among six major monetary gauges, five are now graded bullish, compared with just three a few months ago, and zero at the end of 2018.
Monetary Madness
We always do our own work and draw our own conclusions. Lately, though, we’ve wondered what the late “Monetary Marty” Zweig might say about the stock market’s current liquidity backdrop.
It Wasn’t Powell Who Panicked
The Fed’s “Christmas capitulation” seems to get most of the credit for the stock market rebound, but we’re not exactly sure how, or even if, the Fed capitulated at all.
About That Great Jobs Report...
The December employment report temporarily eased fears of a severe U.S. slowdown. That’s a mystery to us.
.jpg?fit=fillmax&w=222&bg=FFFFFF)
