Major Trend
Introducing The “New” MTI
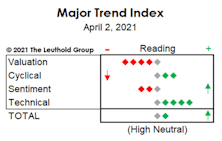
We launched a revamped version of our Major Trend Index. The objective of the new methodology is to increase the flexibility, and even the subjectivity of the MTI. This approach recognizes the “subjective reality,” without forcing us into the tedium of re-weighting sub-factors if they become more or less critical as market dynamics evolve.
The Correction That Scared No One
The setback from the January 26th market peak represents the ninth correction of 7% or more since 2009, the most ever recorded during a single cyclical bull market.
Most Likely Just A Correction
So, what happened to the January Barometer—the old analyst’s maxim that a market gain in January portends a gain for the full year?
MTI Rose 0.01 Points To 1.20
The Major Trend Index rose 0.01 points to 1.20 in the week ended November 11th, with big swings within the MTI’s five factor categories essentially cancelling one another out. Net equity exposure in the Core and Global Funds remains at its 63% target, with no changes made in recent weeks. It’s clear, as one pundit put it, investors are betting on “tax-cut Trump” rather than “trade-war” Trump.
MTI Declined 0.01 Points To 1.29
The Major Trend Index declined 0.01 points to a ratio of 1.29 in the week ended October 21st, marking the 12th consecutive week the Index has been above the 1.20 level.
MTI Pushes To 3-Year High
The Major Trend Index pushed further into bullish territory based on data through last week, rising 0.09 points to a three-year high 1.22 ratio. Improvement in both the Momentum and Economic categories drove the gain. In addition, there were positive developments based on yesterday’s month-end prices that will be captured in the next MTI reading.
MTI Climbs To High End Of Neutral Zone
This bullish action forced us to reverse a small mid-month addition to our equity hedge, and net equity exposure in the Leuthold Core and Global Funds is now 46%.
MTI Negative, But Improving
The Major Trend Index rose 0.10 points over the last five weeks. Despite its improvement, the underlying message is that a cyclical bear market remains underway.
MTI Negative; Market Rally Remains Intact
The Major Trend Index ticked down 0.01 point to a ratio of 0.86 using data for the week ended February 26th. Losses in our sentiment and valuation work offset the technical improvement that had stemmed from recent market gains. The economic category stabilized following a multi-week slide, although there’s no sign the current earnings recession has begun to abate.
MTI Negative, Bear Market Rally Underway
For the second week in a row, the Major Trend Index gained 0.02 points to close at a ratio of 0.87 using data for the week ended February 19th. We believe a bear market rally remains underway and have positioned the Leuthold Core and Global Funds with net equity exposure of 42%, compared with levels near 32% in the third week of January.
MTI Negative, But Don't Rule Out Near Term Rally
Based on data for the week ended February 12th, the Major Trend Index rose 0.02 points to a ratio of 0.85, as a handful of positive technical developments pulled up the Momentum/Breadth/Divergence category by 100 points. Those developments were part of what triggered us to cover another portion of our equity hedge last week. That move, and subsequent market action, have brought net equity exposure in the Leuthold Core and Global Funds to about 42%, up from as low as 32% in the third week of January.
On High Alert
August is “National Eye Exam Month,” but this is the rare year we can confidently recommend that you skip it.
Stock Market Observations
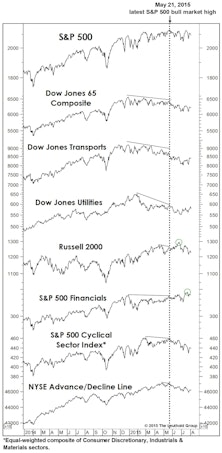
The U.S. stock market has largely shrugged off the latest round of worries related to China’s stock market collapse, the new down-leg in crude oil, a more hawkish tone in Fed-speak, and sizable second-quarter declines in S&P 500 sales and earnings.
Summer Trouble?
New late-June highs in NASDAQ, Small Caps, and key Financial groups weren’t enough to stem the past few weeks’ slide in the Major Trend Index, which has landed back in its neutral zone (1.01 reading).
A Venerable Monetary Indicator Turned Negative
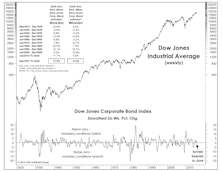
The smoothed, 26-week rate-of-change in the DJ Corporate Bond Index, a reliable indicator of monetary conditions over many different market and economic cycles, turned negative in mid-June.
MTI Declines In May Despite New Market Highs
The MTI dropped to 1.08 in May, despite a move by the DJIA and S&P 500 to new cycle highs. Net equity exposure remains around 61% in the Core and Global Funds.
MTI Range-Bound In Neutral Zone Throughout November
We don’t yet know whether our second-half adjustments to equity exposure will prove premature or just plain wrong. Our tactical funds remain positioned with below-average net equity exposure of about 50%.
Major Trend Index Remains In Neutral Territory
The weaker pattern of MTI readings since August 1st supports the reduced net equity exposure in our tactical portfolios (targeting 55% net equities since early August).
The MTI, And More Market Maxims...
Someday in the faraway future, in the midst of a low-volatility, peace-time bull market, we plan to write a Green Book “Of Special Interest” piece on the investment wisdom of Yogi Berra. “Ninety percent of the game is half mental.” Classic. “You can observe a lot by watching.” Words that I live by.


