Median Valuation
Estimating The Upside?

The remarkable stock market breadth and momentum chronicled in these pages doesn’t come without a price.
Estimating The Downside
We remain cyclically bullish on equities, but nonetheless like to engage in occasional downside “target practice” to shape our expectations for the next bear market.
Sizing Up Small Caps
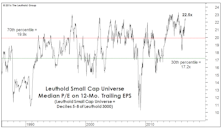
While the most inflated domestic-valuation readings are found in the Large Cap realm, the market rebound has driven the median 12-month trailing P/E in our Small Cap universe to 22.5x (Chart 1)—less than a point away from the June 2015 all-time high of 23.3x.
Bubble Or Not?
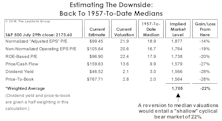
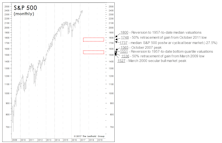
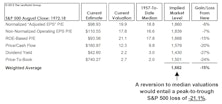
To revisit the all-time valuation peak of March 2000, the S&P 500 would have to reach 3455 (not a forecast!). A reversion to 1957-to-date median valuations implies an S&P 500 loss of 22%. That’s a serious loss, but hardly on the order of a “busted bubble.”
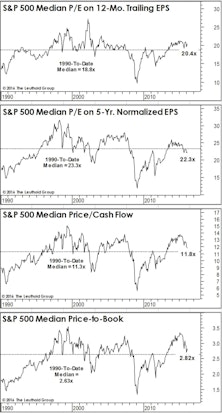
Another Look At Median Valuations
While the past several months’ reversion in valuation measures has certainly wrung some of the risk out of the market, if the bear market reasserts itself and drives stocks to valuations seen at average cycle lows, downside risks are still substantial.
How Far Could It Fall?
Broadly Expensive — Downside To Past Market Highs (And Lows)
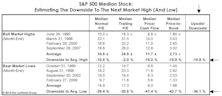
The median S&P 500 stock is now expensive enough that we’re able to estimate its potential downside to prior bull market highs! Based on an average of four valuation measures, the median stock needs to drop about –11% to match the typical valuations at the eve of a cyclical bear market.
Estimating The Downside - September 2013
The S&P 500 lost 3.1% (price only) in August. Based on the valuation metrics presented in the table below, the S&P 500 is 8% above its historical average. The S&P Industrials (excludes Utilities and Financials) now has 20% downside to reach mean valuation.
Estimating The Downside - August 2013
The S&P 500 gained 4.9% (price only) in July. Based on the valuation metrics presented in the table below, the S&P 500 is 12% above its historical average. S&P Industrials (excludes Utilities and Financials) now have 21% downside to reach mean valuation.
The Median P/E Valuation Benchmark

When stocks get back to median valuation levels, the odds are the stock market is at or close to its lows.
The Historical Significance Of Median P/E Valuations

70% of all the market declines since 1945 (post WWII), bottomed within 10% of the median historical normalized P/E ratio.
Is The Stock Market's Current P/E Dangerously High?

It is possible for new bull markets to emerge from high P/E levels. Earnings are cyclical, so when earnings decline in a recession, it can mark a very good buying opportunity despite high P/Es.
Case For A Bear Market Bottom

I now think the stock market will record its secular bear market lows between now and Thanksgiving. It’s time right now to start an equity accumulation program.
Why We Conclude Equities Are No Longer Overvalued
Explanation of how we use historical valuations to compare to today.
I’m Still Afraid of Heights

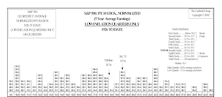
Intrinsic Value benchmarks for each stock market average, using 1957 to date data. Using 1926 to date data the calculations are even more frightening.
Valuations in Low Inflation Environments

Low inflation environments versus “new era” valuations. Examining low inflation environments only, with our “Upside/Downside” factors, there is still 34%+ downside to median valuation levels (1957 to date).
Watch Out Below

Four possible upsets to bullish complacency.
Perception for the Professional
March 2026 Issue

Featured Articles
Sector Navigator
March 2026 Issue
