NYSE Advance/Decline
Breadth Catch-Up!
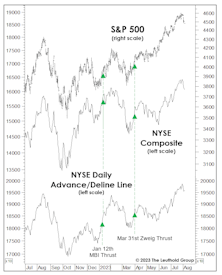
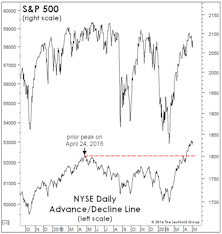
The market broadened enough in July for the NYSE Daily A/D Line to “confirm” new SPX highs—a statistical positive: When the A/D Line made a concurrent 12-month high during July, the average return for August-December was +6.5% versus -1.1% when breadth didn’t confirm the index.
If It’s A Bull, How Does It Stack Up?
Although we can’t claim that the 2022 decline purged the economic and stock-market excesses for another multi-year bull, there’s nothing in the action of the S&P 500, itself, that exposes its upswing as fraudulent.
Neutral (But Leaning Negative)
U.S. stocks have either begun one of the most underwhelming and economically illogical bull markets in history, or have staged an exceptionally long and deceptive bear market rally. Our bet is on the latter.
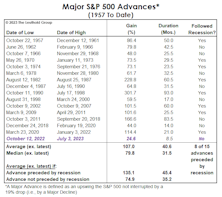
Market Odds For The Second Half
.jpg?fit=fillmax&w=222&bg=FFFFFF)
With the halfway point of 2023 two weeks away, the S&P 500 has broken out to a 12-month high. The index has accomplished that feat 32 times during the month of June—or exactly one-third of all cases measured back to 1928.
Pause, Then “Paws?”
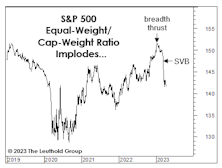
Despite the Fed’s tough-talk about getting the funds rate above 5%, monetary and liquidity measures are significantly less bearish. Thank SVB depositors, who required a bailout big enough to reverse five months of QT in just two weeks. The market reaction looks like that after September 2019’s Overnight Repo-market turmoil, which forced the Fed to end its first experiment with QT.
Not Dot-Com
Bulls have been quick to assure us that this market “bears” no resemblance to the dot-com bust. We agree—but probably for very different reasons. Among them are the conventional breadth measures, which provided little warning of this year’s January peak. And, the initial decline off January’s top has been much broader than during the first phase of the dot-com bust.
X-Rays And EKGs
In late March, the S&P 500 rallied to within 3.5% of its January high, likely prompting producers at CNBC to put in an order for “S&P 500 5,000” hats. But we think that 4,000 will be undercut before 5,000 is topped, and action in key indexes (with the notable exception of the S&P 500 itself) reinforces our view.
The State Of The “Tape,” Before The Taper
Technical types who have the luxury of avoiding the worsening valuation, inflation, and liquidity backdrop probably view today’s market as a much “safer” one than has existed for many months, now that breadth and leadership cracks have been mostly sealed up.
The Trend Is A Bit Less Friendly
The MTI’s move to its Negative zone with the October 1st reading was driven by a few trend breakdowns—ones that could well reverse in short order. Recognizing the volatility of these signals (and perhaps having been “conditioned” by the one-way market of the last 18 months), we opted for just a minor asset allocation adjustment.
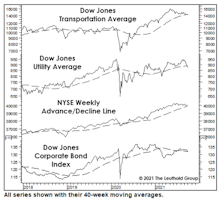
Testing The Transports
A new market high that is not confirmed by the stocks of companies that “move the goods” is a warning signal. We reviewed the Transports’ action in all years the S&P 500 accomplished a 12-month high during the month of July, like it did this year.
Out Of The Blue?
There have been long-time divergences between blue chips and other market segments signaling that all is not “in gear” beneath the surface—but this cautionary activity never foretells the “timing.” Recently, Small Caps, the Value Line Arithmetic Composite, and Dow Transports staged pathetic bounces off the January 31st “Coronavirus 1.0” low, while the blue chips had strong momentum into mid-February. Normally, such divergences typically last for at least 3-4 months before they become meaningful.
Charts Are In The Eye Of The Beholder
After last year’s 30% S&P 500 gain, many strategists are now suggesting that the real melt-up still lies ahead. We think a melt-up has already occurred, and the bulk of it has been booked.
More Extreme Than 1999?
We noted that the December 2018 stock market low was the second most expensive in history, second only to that of October 1998. Similarities between 2019 market action and the 1998-99 rebound remain eerie. Something isn’t right, and it’s not bullish.
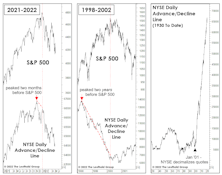
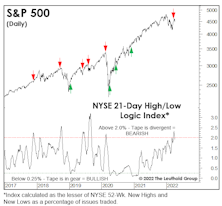
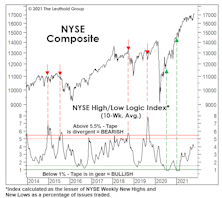
Breadth: Is It Different This Time?
The granddaddy of all technical indicators—the NYSE Daily Advance/Decline Line—continues to make new highs alongside the S&P 500, suggesting the market should move to even higher (but perhaps narrower) highs well into the fall. As noted a month ago, we increasingly suspect that granddaddy may be telling a lie.
The Market Is On Fire… Unless It’s Ice
.jpg?fit=fillmax&w=222&bg=FFFFFF)
Yesterday’s S&P 500 new all-time high triggered a few simple internal studies we’ve used to help shape second-half expectations for the stock market.
Deflation And Deception
.jpg?fit=fillmax&w=222&bg=FFFFFF)
We think the current economic cycle is more likely to end in a deflationary bust than with a bout of late-cycle “overheating,” and analysts and investors should recognize that such a cycle ending could be especially difficult to detect.
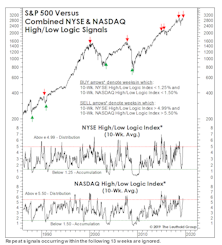
“Four On The Floor”
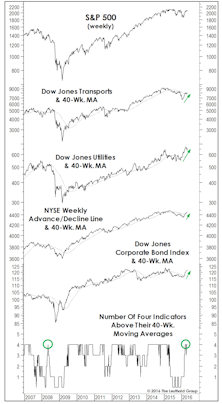
Leadership, breadth, and corporate credit all staged intermediate-term breakouts, rising above their respective 40-week moving averages. In this formation, historically, S&P 500 annualized return is +15%.
Sizing Up The Rally
While our MTI became bullish in mid-April, we can’t rule out that the rebound from February lows could be an impressive bear market rally. However, this rally sports impressive technical credentials.
Market Internals—Breadth Weakness Troubling But Not Dire
Remember that peaks in market breadth tend to lead peaks in the S&P 500 by at least a few months.
Transports Still Leading - Market Top Not Imminent
While stock market action YTD has not been quite as “uniform,” the hallmarks of an imminent bull market top are simply not present. The bullish portents apply to intermediate term results, however, they cannot rule out any short-term setbacks (which can appear with no tip-off from breadth or leadership measures).
Perception for the Professional
March 2026 Issue

Featured Articles
Sector Navigator
March 2026 Issue
