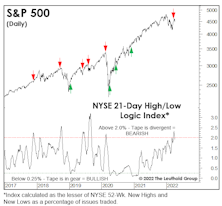
NYSE High/Low Logic Index
Not Quite In Sync

At nearly 4-1/2 months, the stock market rally has reached an age where the Technical confirmation should be overwhelming if the upswing is in fact the first phase of a “new” bull. That’s not what we observe, however.
Don’t Trust The Thrust…

Jay Powell’s speech on November 30th triggered a 1,000-point intraday reversal on the DJIA and left us wondering who might have slipped the Chairman a recent copy of the Green Book.
Beware Of The Changing Of The Guard
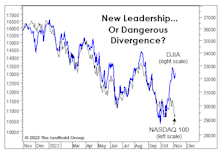
A rotation from Growth to Value resumed in grand fashion in October. Qualitatively, new leadership sounds like a good thing. Statistically, bulls ought to hope that the tape gets back into gear.
A Morsel For The Bulls
The MTI’s Technical category is still decisively negative at -3, but some of its shorter-term “counter-trend” components look intriguing for the first time in 2022’s entire decline. In particular, we’re watching the behavior of a group of indicators that performed brilliantly near the bull market highs.
What Will A Low “Look Like?”

We think it’s much too early to be looking for a major bottom in stock prices, but it’s worth reviewing some of the signals that will help confirm such a low is at hand.
Not Dot-Com
Bulls have been quick to assure us that this market “bears” no resemblance to the dot-com bust. We agree—but probably for very different reasons. Among them are the conventional breadth measures, which provided little warning of this year’s January peak. And, the initial decline off January’s top has been much broader than during the first phase of the dot-com bust.
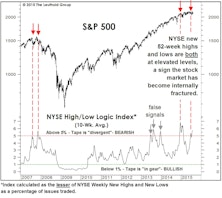
X-Rays And EKGs
In late March, the S&P 500 rallied to within 3.5% of its January high, likely prompting producers at CNBC to put in an order for “S&P 500 5,000” hats. But we think that 4,000 will be undercut before 5,000 is topped, and action in key indexes (with the notable exception of the S&P 500 itself) reinforces our view.
Limping Into Wildcard Weekend With A Compound Fracture
.jpg?fit=fillmax&w=222&bg=FFFFFF)
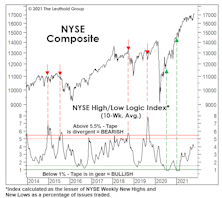
We wrote in the latest Green Book that a breadth indicator that should be more well-known than it is—the High/Low Logic Index (or HLLI)—had moved to “maximum negative” right at the cycle high in the NASDAQ Composite on November 19th. Specifically, the 10-week moving average of this indicator showed a perilous internal condition in which too many NASDAQ stocks were reaching 52-week New Highs and New Lows simultaneously. That’s the very definition of a “fractured” market, and has preceded some important NASDAQ declines. There have also been a couple of premature warnings, as in the summers of 1996 and 2019.
The State Of The “Tape,” Before The Taper
Technical types who have the luxury of avoiding the worsening valuation, inflation, and liquidity backdrop probably view today’s market as a much “safer” one than has existed for many months, now that breadth and leadership cracks have been mostly sealed up.
Reading The Short-Term Tea Leaves

The stock market’s technical backdrop remains pretty hard to assail, as evidenced by the current +4 reading on the revamped MTI’s Technical category. But there are a few short-term cracks that bear watching.
The High/Low Says “Buy High!”
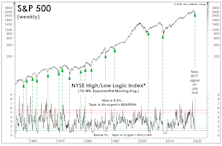
We’ve written periodically about the likely distortion of market breadth figures resulting from High Frequency Trading, the domination of ETFs, and (we believe, most importantly) the decimalization of stock quotations. Our concerns led us to expand our technical arsenal, and one of the gems we uncovered in that process was the High/Low Logic Index (HLLI).
“Quant Quake” But No Market Quake

Value, High Beta, and Small Cap stocks all captured a few rays of sunlight for the first time in a long while. It’s too early to tell if last month’s leadership U-turns can be sustained, but major market trends are the most susceptible to reverse during cyclical bear markets.
A Final Warning

This Stock Market section’s unifying theme has been that of an historically two-tiered market, one in which Domestic, Large Cap, Growth, Consumer-oriented, and Low Volatility stocks have reigned supreme.
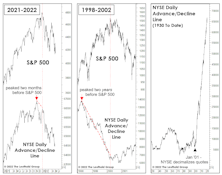
Breadth: Is It Different This Time?
The granddaddy of all technical indicators—the NYSE Daily Advance/Decline Line—continues to make new highs alongside the S&P 500, suggesting the market should move to even higher (but perhaps narrower) highs well into the fall. As noted a month ago, we increasingly suspect that granddaddy may be telling a lie.
Are New Lows The Key To New Highs?

Last year’s market decline was one of the largest to have occurred without a lengthy-preceding period in which breadth narrowed and Small Caps significantly underperformed.
Why So Many Lows Near A New High?
.jpg?fit=fillmax&w=222&bg=FFFFFF)
The S&P 500 has closed within a half percent of an all-time high three times this week, and the S&P 1500 Composite did make such a high on Tuesday, August 21st...
Multiple Personality Disorder?

Market behavior is always nebulous enough to generate diverging opinions, but lately it’s been sufficiently strange to give rise to a diverging set of facts.
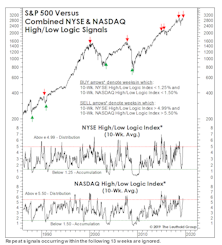
Too Many Highs, Too Many Lows??

In the past few years, we’ve shared our concerns that traditional market breadth measures may have become compromised by several developments.
Too Many New Highs To Make A High?
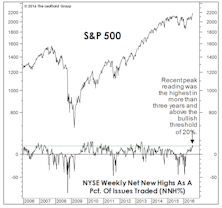
The number of NYSE 52-Week Highs typically peaks during the bull market’s strongest leg, before contracting into the final top. Last month, Net New Highs made a three-year high—implying more upside.
Too Many Highs, Too Many Lows
We’ve detailed the growing degree of stock market bifurcation, but the problem for would-be bears is that such bifurcation can reach astonishing levels (witness 1999-2000) before the market is set to peak out.
Industry Groups: No Need To Bottom-Fish
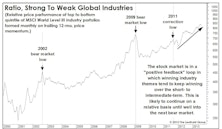
Buying global groups with strong price momentum has been a winning strategy. Will it continue?
Weekly New High/New Low Data Not Yet Indicating A Stock Market Bottom

We meticulously comb through the lists of weekly new highs and new lows so that we exclude those derivatives and non-operating companies, in order to get a true picture of the stock market health.
Perception for the Professional
March 2026 Issue

Featured Articles
Sector Navigator
March 2026 Issue
