NYSE
Technical Difficulties
Traditional breadth measures have yet to show end-of-cycle thinning of the ranks, but some secondary measures suggest that process may be underway.
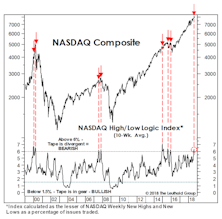
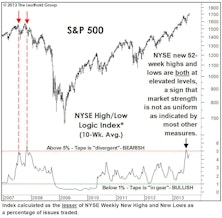
Why So Many Lows Near A New High?
.jpg?fit=fillmax&w=222&bg=FFFFFF)
The S&P 500 has closed within a half percent of an all-time high three times this week, and the S&P 1500 Composite did make such a high on Tuesday, August 21st...
Stock Market Observations
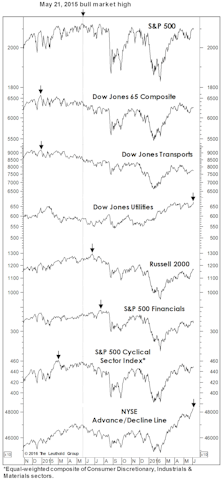
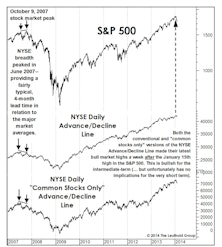
After a two-month lull, stock market momentum reasserted itself in May bringing our summer S&P 500 target of 2,600 back into focus… Meanwhile, we’ve fielded several media calls about the “FANG” stocks’ large contribution to some YTD returns—but that doesn’t diminish the new highs being made elsewhere by disparate groups… NYSE Weekly A/D Line and New Highs/Lows figures also suggest the stock market isn’t yet top-heavy enough to tip over.
Charts: Beware Of Myopia
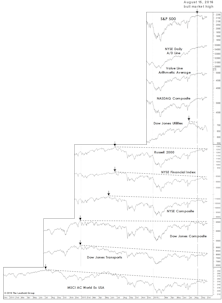
Despite a two-month stall in the blue chips, the breadth and momentum behind the market’s rally off mid-February lows remain hard to deny.
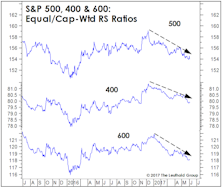
Stock Market Breadth: So Good We’re Suspicious
Market breadth measures have been so strong since the February low that we wonder whether something might be wrong with them.
Stock Market Observations
Commentators now label this cyclical advance the “seven-year bull market,” but that won’t be semantically true until the S&P 500 closes above its May 2015 peak of 2130.82.
NYSE “New Lows” Figures Point To “Lower Lows”…
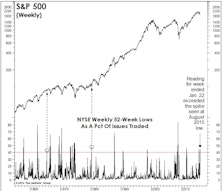
At the August and late January S&P 500 lows, both the Daily and Weekly NYSE New Lows figures exceeded 40% of Issues Traded —a degree of downside thrust rarely seen outside of bear markets.
The NYSE: A Timely Insider Sale
We tracked the “legal” insider actions of NYSE specialists for many years, until a crackdown on that business model early last decade rendered our old data sets virtually irrelevant.
Weakening Foundation
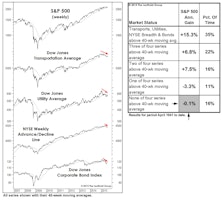
Over the last few months, we’ve presented a couple of simple quantitative studies meant to encapsulate the factors driving our Major Trend Index to the brink of bear territory. The chart and table might provide the best summary yet.
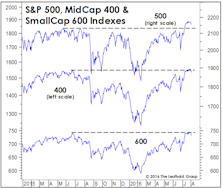
Too Many Highs, Too Many Lows
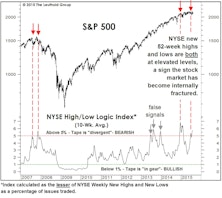
We’ve detailed the growing degree of stock market bifurcation, but the problem for would-be bears is that such bifurcation can reach astonishing levels (witness 1999-2000) before the market is set to peak out.
What The Market Tells Us About Fed Policy
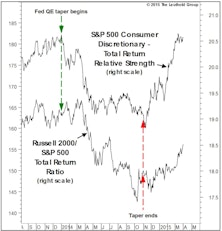
Poor performance in 2014 by two typical victims of Fed tightening—Consumer Discretionary and Small Caps—corroborated our argument that “tapering” is tightening.
What To Make Of Market Leadership
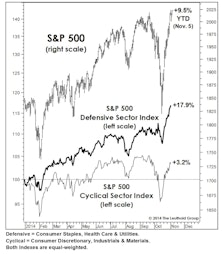
The renewed embrace of risk hasn’t extended to the sector level. After resisting decline in late September through mid-October, defensive sectors have matched the rebound in Cyclicals, almost point for point.
Margin Debt: Much Ado About Not Very Much
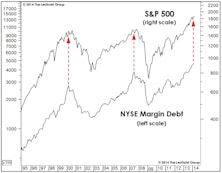
Margin debt levels are high, but that’s because stock prices are high. The critical relationship is the comparative rates-of-change in Margin Debt and stock prices.
Too Early For The Top?
January’s new breadth highs suggest new bull market price highs are likely some time in the next several months… but they can’t rule out a painful February.
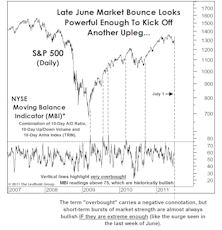
Not Your Typical Bear Warnings...
With July’s market surge producing new cyclical highs in virtually every important subgroup (other than Utilities), it’s difficult—if not dangerous—to question the U.S. stock market’s technical underpinnings.
“Immature” Market Behavior
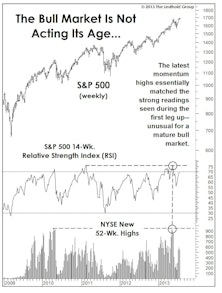
Whether one considers the post-2008 upswing two bull markets or one ultimately matters only to those who (like us) enjoy cataloging such things. But labeling the 2011-2013 rally a new bull market would certainly explain some of the “immature” behavior exhibited by U.S. stocks in recent months.
Is The Glass “Half Full”?
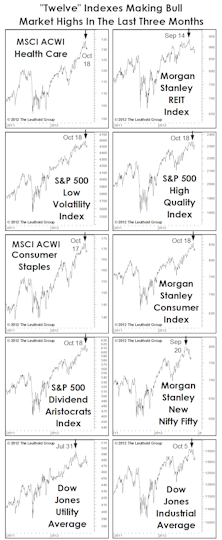
A “dozen” major market measures have moved to new bull market highs in the last three months. But many of these have been the groups that do best when “risk” is “off,” and may be a reason “Ain’t Nobody Happy,” even in an up year.
Yet Another Breadth Blastoff
Another breadth blastoff gives us reasons for optimism that our bullish predictions for the end of the year will hold.
Some Erosion - But Not A Collapse - In The Wall Of Worry
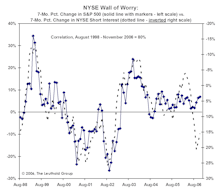
The surprising restraint in investor enthusiasm has been a key pillar behind our bullish case for the stock market.
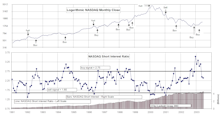
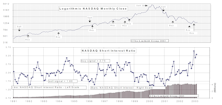
NASDAQ & NYSE Short Interest
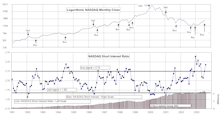
New NASDAQ buy signal as volume declines. NYSE short interest ratio increases again as volume and short interest both decline.
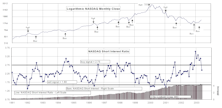
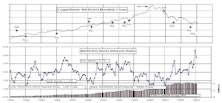
NASDAQ & NYSE Short Interest
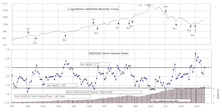
Both the NYSE and NASDAQ short interest ratios saw increases in July.
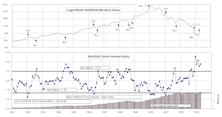
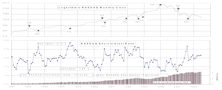
NASDAQ & NYSE Short Interest
While the NASDAQ short interest ratio continued to decline, the NYSE ratio increased in June.
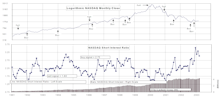
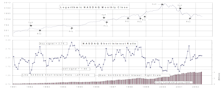
NASDAQ & NYSE Short Interest
Both indicators drop to neutral in May.
NASDAQ & NYSE Short Interest
Both the NASDAQ and NYSE short interest ratios increased in April.
NASDAQ & NYSE Short Interest
Both ratios still bullish.
NASDAQ & NYSE Short Interest
Both ratios reconfirming a buy signal.
NASDAQ & NYSE Short Interest
NASDAQ ratio declines on increased volume. A new style this month gives the NYSE ratio more timely signals.
NYSE Moving To Westchester Is Not Nearly Enough

This month’s feature was written by Don Weeden, still a Maverick and Innovator! Named one of the fifty most significant people in the securities business since 1950. “…...The world’s premier market center remains dangerously exposed. A move to Westchester won’t diminish the danger.”
NASDAQ & NYSE Short Interest
NASDAQ record high short selling. NYSE moving to new highs.
NASDAQ & NYSE Short Interest
NASDAQ ratio was flat for May while the NYSE's showed a very strong positive.
For The Technicians
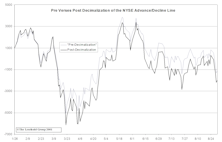
Examining some of the impacts that decimalization and the inclusion of financial derivatives may have on the NYSE Advance/Decline Line & ARMs Index.
View From The North Country

“What? You’re buying MORE Junk Bonds?!” “Regulation FD” could ultimately improve the depth and quality of analyst research, turning the focus back to more relevant, longer term outlooks. “Sell Side” Stock Research: The reasons why we no longer use it.
The Growth In NYSE Stock Listings

Since 1990, the number of listed stocks on the NYSE has increased by almost 90%. This surge in the number of listings can have a significant impact on a great many tools of the technician’s trade.
Brought To You By Your Friends (?) At the New York Stock Exchange

In recent months, two studies have been released on the subject of program trading, particularly index arbitrage. One concludes that index arbitrage activities do no real damage. The other tells it like it really is.
Perception for the Professional
March 2026 Issue

Featured Articles
Sector Navigator
March 2026 Issue
