P/E Ratios
Sliced Breadth
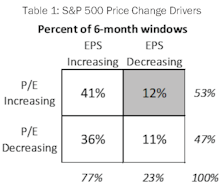
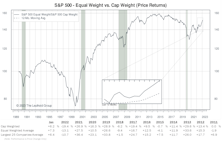
The S&P 500 posted a 7.7% price gain for the six months ended April 30th, although this advance has been a hard-fought battle as gains have resulted from a narrow list of drivers. Style leadership has been concentrated in mega-cap tech names, such that the ten members of the NYSE FANG+® Index have produced 77% of the S&P 500’s YTD gain. Furthermore, gains over recent months have resulted solely from expanding multiples. Narrowness in either thematic leadership or price drivers is concerning because breadth is a useful concept in evaluating the staying power of a market advance. In light of this year’s market action, we are intrigued by the notion of measuring breadth not simply by price moves alone but by examining each of these two important sub-components individually. Does today’s environment, where price gains are driven by valuation increases alone, tell us anything about future market returns?
Research Preview: Market Narrowness In 2023

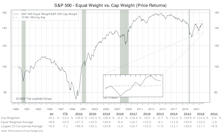
The S&P 500 posted an encouraging +9.2% YTD, but below the surface that strong return was the result of a limited number of influences. There is narrowness in both thematic and return drivers; the fact that gains have not been broad-based is cause for concern about performance during the remainder of 2023.
QE Fuels Inequality—Even Among Stocks
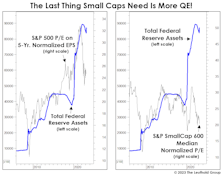
We don’t know enough about banking-system mechanics to conclude if the Fed’s balance-sheet increase associated with March’s bank bailout constitutes a new round of QE. But if it is, we’re skeptical equity investors should celebrate it. In fact, those running Small-Cap portfolios should probably fear it!
George Bailey Goes To Silicon Valley
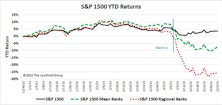
One of the most vivid memories of the Great Depression is the sight of nervous depositors lined up outside a bank hoping to withdraw their meager savings before the bank failed. Like a rare tropical disease that was thought to be eradicated by modern medicine, the classic bank run reappeared this month in the form of Silicon Valley Bank. At the beginning of March, the market had no particular concerns about the potential for systemic bank failures, but SVB’s sudden demise has cast a pall over the entire industry.
Masquerade Party
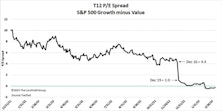
Style investors recently witnessed a rare event when, on February 13th, the P/E ratio of the S&P 500 Growth Index fell below that of the S&P 500 Value Index. At first glance, it is tempting to attribute this valuation flip-flop to the 2022 bear market, which saw Value outperform Growth by a whopping 24.2%. However, the bear-induced collapse of Growth stock prices in 2022 only served to return the P/E spread to a level just below its historical median of 5.1, meaning that the final move toward parity was caused by a force outside the market itself. That “something else” was the S&P 500 style reconstitution that occurs annually on the third Friday of December.
Additional Factors
The S&P 500 had an almost biblical upheaval to start 2023. The “last were first” and the “first were last.” In January, the 100 worst performing stocks of 2022 had an average return of +16.1% while last year’s 100 best performers posted +1.7%.
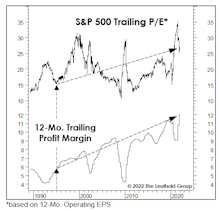
A Valuation Check-Up
The P/E multiple on Trailing Peak GAAP EPS has plunged 44% from its year-ago peak of 32.5x. The current ratio of 18.1x is below its “New Era” median (1995-to-date) —but some conditions characterizing the New Era no longer apply.
Additional Factors
The six-week rally that started mid-June featured advances from AAPL (+25%), AMZN (+30%), and TSLA (+39%), which accounted for one-fourth of the S&P 500’s gain. Despite the recent preference for Value, a spike in interest rates, and the bear market, the index’s concentration in the top-five firms is still near it’s all-time high set in August 2020.
“Recessionary” Valuations?
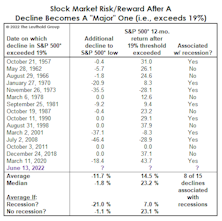
The bear was a mere cub back in March when we examined the historical record of buying S&P 500 dips in the -10% to -12% range. “Blindly” buying them turned out to have mediocre returns, but we illustrated that the positions of various business-cycle indicators could help one determine whether or not catching the proverbial “falling knife” was warranted.
Who Doesn’t Love A Sale?

The S&P 500 closed May 5th with a moderate 13.5% loss from its all-time high, a move that explains only part of what’s already been an historic bear market—in P/E ratios, that is.
New-Era Profits, New-Era P/E Multiples
The current mania won’t last forever. But our use of the “New Era” label in describing the last-quarter century or so of stock-market dynamics is still useful—in part because it highlights fundamental developments that simply cannot be repeated indefinitely.
A Good Year For Cheapskates
For our more fundamentally-oriented readers who are repulsed by all this talk of momentum, we have an alternative. Just forget about performance and focus solely on value!
Our Annual Lament On Foreign Equities
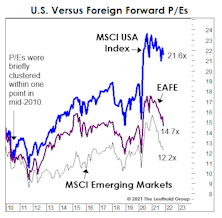
There should be a name for the syndrome suffered by foreign stock investors over the last decade or so. “Groundhog Day” doesn’t quite cut it, because that event repeats only once a year. It seems like this time of year we always feature a chart showing a healthy YTD double-digit gain in the S&P 500, along with a bond-like gain in EAFE, and a bond-like gain or loss in the MSCI Emerging Markets Index.
Big Time
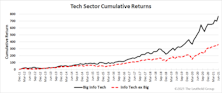
Market environments are driven not just by industry preferences, but also by a bias toward the very largest companies. We have developed a new set of groups composed of the 10 largest companies from each sector. With several of these baskets sporting positive rankings, we felt a closer look was in order.
The “Rule Of Twenty” Revisited
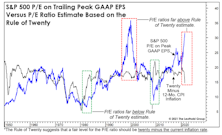
Pundits could reasonably argue the market has never been more expensive in light of the prevailing rate of inflation. That’s the conclusion of the “Rule of Twenty,” which proposes that the stock market’s P/E ratio and the trailing 12-month Consumer Price Inflation rate should sum up to 20.
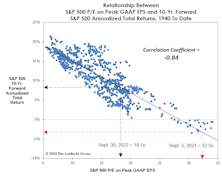
What If The Valuation Message Turns Out To Be Really Wrong?

Today’s Peak P/E ratio implies the S&P 500’s ten-year-forward annualized total return will be in the range of -3%. If this P/E ratio turns out to be as deceptively pessimistic as it was at its worst point in history, the S&P 500 could produce an annualized nominal total return of about +5% over the next decade.
A Closer Look At The “Rule Of Twenty”
.jpg?fit=fillmax&w=222&bg=FFFFFF)
Inflation and its potential impact on the stock market is the topic du jour, resurrecting ideas that were in vogue 30- to 40-years ago.
Steve Leuthold’s 1980 book, The Myths of Inflation and Investing, provided an exhaustive review of the evidence. But for lighter reading, more appropriate for a summer Friday, we revisit the “Rule of Twenty” developed by strategist Jim Moltz in the early 1980s.
Music For The “Mania”
At some point during the June/July streak of seven-consecutive S&P 500 daily-closing highs, an album from 1980 popped into our heads: Nothin’ Matters And What If It Did—released when John Mellencamp was still known as John Cougar. It brought to mind some “nothin’s” that seem not to matter.
Looking Forward To 2021 Earnings
.jpg?fit=fillmax&w=222&bg=FFFFFF)
As we turn the page on 2020, a peek ahead to the S&P 500’s 2021 operating earnings is probably in order. You never know, earnings and valuations might be important again one day.
It’s Demographics, Stupid! (Not The Economy.)
_Page_1.jpg?fit=fillmax&w=222&bg=FFFFFF)
Turn on financial television at any random time, and you’re likely to soon hear the argument that still-high U.S. stock market valuations are “justified” by extremely-low interest rates. We’ve countered that these low U.S. rates are simply a reflection of the secular slowdown in economic and earnings growth.
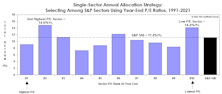
For Value Investors Only!
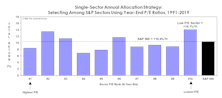
With the possible diminution of “alpha” in price momentum strategies, we recommend that sector allocators consider approaches that are more countertrend or contrarian in nature.
No Place Like Home For The 2010s
We thought we’d get a jump on all the “End of the 2010s” retrospectives you’re sure to see next month. Though not quite yet the official end of the decade, the changing of the “tens” digit definitely has a certain gravitas to it.
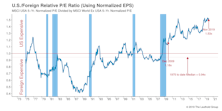
Low Rates Don’t Justify Higher P/E Ratios (And U.S. Investors Should Be Glad)

The fear (or hope) that U.S. bond yields would fall to zero or below subsided over the last month. However, the belief that low yields merit significantly above-average P/E ratios remains stronger than ever.
Low Vol For All Seasons?

The early August setback took the S&P 500 below its late-January 2018 high—and the time when we first trimmed net equity exposure in Leuthold tactical funds from a nearly fully-invested posture.
The Small Cap Discount Deepens

Small Caps typically underperform during a bull market’s final phase, and our findings with respect to the Output Gap aid our understanding of that phenomenon.
Be Wary Of The “E” In P/E
.jpg?fit=fillmax&w=222&bg=FFFFFF)
U.S. equity valuations remain considerably higher than those of any major foreign market, but there’s no denying they’ve improved from the cyclical peak made in January 2018. That’s true across the capitalization spectrum, and on the basis of both normalized and non-normalized fundamentals.
Think Halloween Is Behind Us? Beware, Zombie Alert!
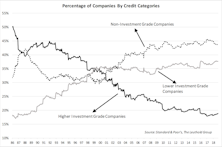
“Zombie” companies are being kept alive by low interest rates and generous credit conditions, and the number of them, worldwide, has risen significantly over the past few years.
P/E Crash!!
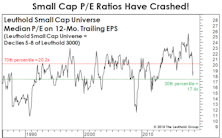
While this year’s liquidity squeeze has yet to exact the toll we ultimately expect on the U.S. stock mar-ket, it has certainly contributed to a sharp compression in P/E multiples.
Revisiting The Y2K Highs
Bobby Knight thought coaching would be perfect “if it weren’t for those damned games.”
Dialing In On Downside Risks
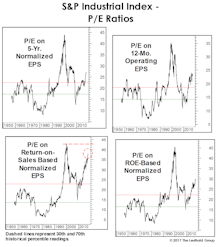
Question: Your “Estimating The Downside” section shows the S&P 500 would lose 26% if it reverts to its 1957-to-date median valuation level. The downside estimate for the S&P Industrials Index, however, is almost -40%. Why such a huge difference?
Today Versus The Tech Bubble Peak

We’ve generally spoken of the market’s “broad participation” as a good thing. And from a purely technical point of view, it is.
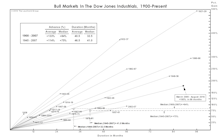
How To (Almost) Double Your Money In Under Ten Years
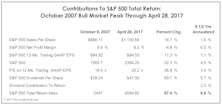
Buying the S&P 500 on one of the worst possible days in history ultimately yielded a total return of +87.4% (+6.8% annualized) through the end of April 2017...darn, sounds like an advert for Vanguard!
A Semi-Annual Checkup!
Call off the mortician, and bring on the pediatrician for the bull market’s 7 1/2-year checkup this month.
Same Ponds, Different Fish?

The impact of atypically-high current valuations has become a challenge for style-box investing. High quality, mature dividend payers have habitually resided in the Value and Blend boxes, but investors have bid up those valuations as they look for alternatives to low bond yields.
No Sector On Sale...

While cap-weighted U.S. indexes remain far below their 2000 valuation highs, in some ways today’s market presents an even more difficult hurdle for value managers.
Low Vol Divergence, Episode 3
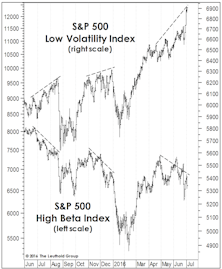
The divergence between S&P 500 Low Volatility and High Beta Indexes has emerged for the 3rd time in a year. The 3-month performance spread is even more extreme than it had been on the eve of either the August or December stock market air pockets.
Small Cap Premium Finally Shrinks—But Remains Historically Extreme
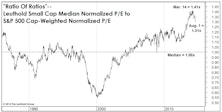
July’s Russell 2000 -6% rout finally deflated some of the Small Cap valuation premium we’ve been grousing about in recent years.
Small Cap Valuation Check

Small Caps have staged a nice rebound in the last several weeks. On July 3rd, the Russell 2000 rose to within a fraction of an index point of its March 4th all-time high. But on a relative strength basis, the bounce has been pretty muted.
Perception for the Professional
March 2026 Issue

Featured Articles
Sector Navigator
April 2026 Issue
