Recession Probability
The Yield Curve And The Problem Of Timing
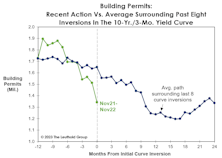
Frequently, there’s money to be made in the stock market in the months following the initial curve inversion. After the inversions of August 2006 and June 2019, the S&P 500 rallied another 23% and 19%, respectively, into its final bull market high. If this cycle plays out in textbook fashion, the business-cycle peak would arrive in September.
Not If, But When
Economists who believe a 2023 recession will be avoided, may not know it but they are “messing with perfection.” Since August, we’ve chronicled several developments that have, without fail, correctly forecasted past recessions, or confirmed that one was already underway.
Which Yield Curve?
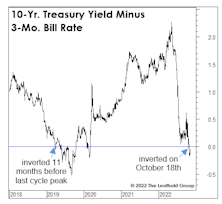
Last month’s inversion in the 10-Yr./3-Mo. Treasury spread further tilts an already lopsided scale in favor of a U.S. recession in 2023. That spread has been considered the gold standard from an economic forecasting perspective, and is the basis for the New York Fed’s Recession Probability estimate (which, by the way, should break above its critical 35% threshold when it’s published later this month.)
Tightening Into A Slowdown: Month Eight
We think the U.S. economy will slip into recession sometime in the next year, but the level of “excess savings” provided by pandemic aid renders the already difficult task of timing more elusive than ever.
Special Study: Should You Buy The Dip? Some Statistical Considerations…
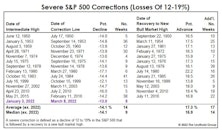
The correction in the S&P 500 since its high on January 3rd qualifies as a “severe” correction, which we define as a decline of at least -12% based on daily closing prices. What are the odds that it becomes a “major” decline*—in which the loss exceeds -19%?
In Section I, we review the history of severe corrections since 1950. In Section II, those corrections are analyzed in the context of the economic cycle, consumer sentiment, and other underlying factors—ones that might help us determine if today’s stock-market weakness is “buyable.”


