Red Flags
The Short-Term Tea Leaves: Suddenly Wilting?
The “Nothin’ Matters” market lifted the S&P 500 to eight all-time highs in the nine trading days through July 7th. It’s been difficult to assail the stock market’s technical merits, but there are suddenly some short-term cracks among the handful of market indexes we consider “bellwethers.”
Stock Market Observations
Throughout the spring and summer, the market could alternatively be characterized as “divergent” or “disjointed”—but until very recently it could not be considered “distributive.” Now, Mid and Small Caps have hit a short-term air pocket and breadth figures were exceptionally poor at September’s scattered highs in the DJIA and S&P 500.
The Flags Are A-Flappin’!
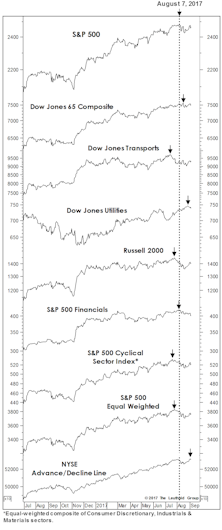
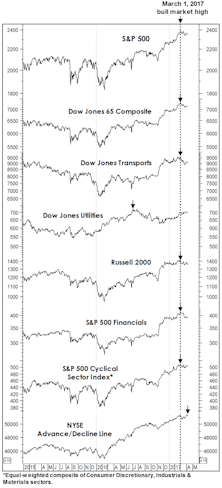
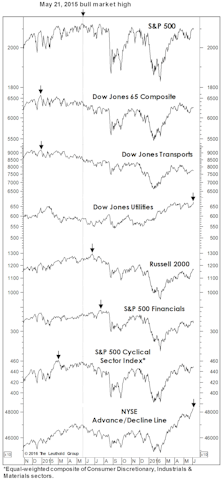
The S&P 500 is on the verge of reversing its early-2018 losses and, if achieved, it would initially be accompanied by six “Red Flags”—which are based on key market indexes failing to record new highs in the 21 trading days preceding a new S&P 500 high. The last time the tally reached “six” was in May 2015—occurring at the final high before an S&P 500 loss of nearly 15% over the ensuing nine months.
Better To Have And Not Need
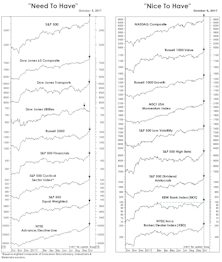
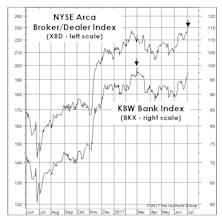
"Need To Have” confirming indexes were nearly all perfectly aligned with the latest market high, and a second set of indexes we consider less critical, but “Nice To Have,” has also been in virtual lockstep.
Stock Market Observations
We believe this bull market still has legs… but so too might the mini-correction that’s hit mainly the secondary stocks thus far.
Stock Market Observations
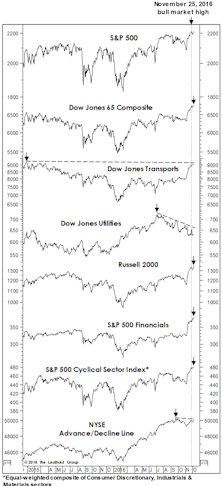
While the S&P 500 remains below our 2,550-2,600 summer target zone, we can’t help but be impressed by the quality of its recent highs—including confirmations by all of the “Red Flag” bellwethers except the S&P 500 Financials (which barely missed a new high on July 7th).
Skies Are Clear, But Travel Not Recommended
Two years ago, we played the role of the bull market’s mortician, preparing it for burial after a six-year run that had taken it to valuations on par with those at the 2007 top.
Stock Market Observations
Second-half results showed the U.S. emerging from the 2015-2016 profit recession, and our early read is that the first quarter should show more of the same.
Stock Market Observations
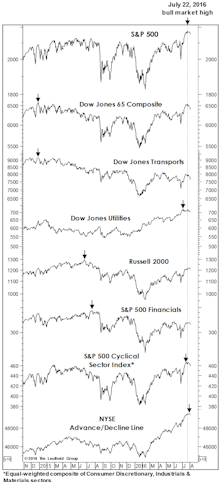
We revisit our “Red Flag Indicator” of prior bull market tops versus today. Usually most of these internal market measures will deteriorate in advance of the final bull market peak. At the latest S&P high, three of the seven leading measures had raised Red Flags, by not confirming, but two of them (DJ Transports and the NYSE A/D Line), are within just ticks of new bull market highs.
Not Entirely In Sync
Despite the market’s strong rebound from February lows, four of the seven “Red Flag Indicator” components have failed to confirm the July new-cycle S&P 500 highs.
Stock Market Observations
Commentators now label this cyclical advance the “seven-year bull market,” but that won’t be semantically true until the S&P 500 closes above its May 2015 peak of 2130.82.
Stock Market Observations
This bull market has appeared to be on shaky technical ground before, only for concerns to be swept aside. This time, we think it’s different.
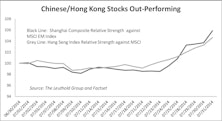
Chinese Stocks: Accounting Red Flag Screen
We examine several models or screens to detect accounting or governance risks.

