Supply
A Shift In Fund Flow Trends Holds Through Latter Half Of 2013

Both equity and bond categories set all-time nominal net cash flow records.
Everyone Should Be A Supply Sider!

Analysts typically focus on demand for products and rarely look at the supply side. Consumer Discretionary companies were rewarded for their pessimistic positioning with better pricing and higher margins.
Cash Acquisitions And Their Effect On Equity Supply
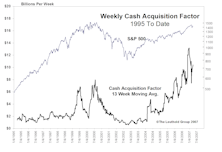
Cash acquisitions shrinking U.S. equity share base.
Net New Equity Supply

A net increase of $30 billion in new supply this year. Quite a reversal from 1999 where YTD $39 billion of new offerings was almost 50% less than cash acquisitions.
Cash Acquisitions
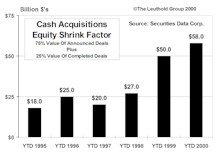
YTD cash acquisitions of $32.3 billion reduces YTD offerings of $49 billion to produce net equity supply of $16.7 billion for the year.
The Big Shrink…Record Level Cash Acquisitions In 1999

In 1999, cash acquisitions of public companies reduced the U.S. equity base at a far greater magnitude than ever before.
The Big Shrink…Equity Evaporation Continues

Through November, the $199 billion of cash acquisitions have outpaced the record $144 billion YTD offerings, producing a net equity shrink of $55 billion.
The Big Shrink…Cash Mergers Slowing, But Still Growing

Through September, there have been $172 billion of cash acquisitions. This is an all-time record, over 59% more than the previous annual record of $108 billion in 1998.
The Big Shrink…Cash Mergers Frenzy Continues
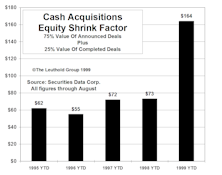
Through August, there has been $164 billion of cash acquisitions. This is an all-time record, over 52% more than the previous annual record of $108 billion in 1998.
The Big Shrink…Cash Mergers Slowing In July, But YTD At An All-Time Record

Through July, there has been $146 billion of cash acquisitions. This is an all-time record, over 35% more than the previous annual record of $108 billion in 1998.
The Big Shrink

1999 YTD cash acquisition factor nearly $100 billion, far exceeding YTD totals for the last four years.
The Big Shrink

1999 YTD cash acquisition factor nearly $82 billion, over 2 ½ times totals for the last four years.
A Different Spin on Liquidity

Cash, as a percent of the NYSE market value, has never been lower.
Major Stock Market Positives and Negatives

A review of the major stock market positives and negatives as Steve currently views them. There are now six major positives and four major negatives.
View from the North Country

A new nationally distributed newspaper has been born, USA Today. This big gamble might just pay off for Gannett. It is refreshing indeed to see a corporation make a big bet on a high-risk long-term investment, especially in this age of corporate timidity and financial mechanics. Also, Irving Kristol’s remarks at the Western Pension Conference.
Perception for the Professional
March 2026 Issue

Featured Articles
Sector Navigator
March 2026 Issue
