Valuations
Premature Aging?
If today’s stock market is indeed a new bull, its vital signs advise that it is more in need of a coffin than a cradle. Monetary policies, both in terms of rate hikes and the inverted curve, have never been more hostile at this stage of a major stock market upswing.
Land Of The Rising Stock
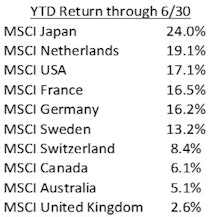
After years of wandering in the wilderness, Japanese stocks are leading the world’s developed markets higher in what has been a robust opening half of the year. The table shows Japan leading the world’s ten largest developed markets (as measured by the MSCI family of international indexes) with a 24% local currency return through June, easily outpacing the pack. Even as the MSCI USA index gained 17% by successfully “fighting the Fed” this year, Japan surged another 7% beyond that outstanding result. We were curious to understand the nature of Japan’s spectacular run in 2023, looking to identify the drivers of this strong and relatively quick jump higher.
Another Chance To “Buy High”
Despite this year’s massive underperformance by the Equal Weighted S&P 500, the median stock doesn’t appear substantially more attractive than the cap-weighted index. Three of five valuation measures are now back in the top decile of readings, which we’d consider pricey in any monetary or economic backdrop.
Be Contrary On Discretionary
The Fed’s June announcement of a pause with further rate hikes to come has extended the uncertainty of whether an inverted curve and persistent policy tightening will ultimately lead to a recession. The business cycle is a critical investment issue because the relative returns of many assets depend on the state of the macro economy. This study examines the Consumer Discretionary (CD) sector’s behavior in recessionary times, with the goal of understanding the typical performance pattern during economic lows in order to help investors position their portfolios for a potential recession.
Research Preview: Recessionary Discretionary
While sentiment on the potential for a recession by year-end is split, there is little dispute that it’s an important question for cyclical sectors. Consumer Discretionary is most exposed to the business cycle, and we are interested in understanding its prospects as we head toward a potential economic slowdown.
Sliced Breadth
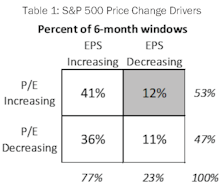
The S&P 500 posted a 7.7% price gain for the six months ended April 30th, although this advance has been a hard-fought battle as gains have resulted from a narrow list of drivers. Style leadership has been concentrated in mega-cap tech names, such that the ten members of the NYSE FANG+® Index have produced 77% of the S&P 500’s YTD gain. Furthermore, gains over recent months have resulted solely from expanding multiples. Narrowness in either thematic leadership or price drivers is concerning because breadth is a useful concept in evaluating the staying power of a market advance. In light of this year’s market action, we are intrigued by the notion of measuring breadth not simply by price moves alone but by examining each of these two important sub-components individually. Does today’s environment, where price gains are driven by valuation increases alone, tell us anything about future market returns?
Small Caps Getting Cheaper By The Day
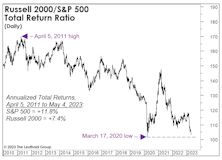
It was September 2020 when we suggested that a new multi-year phase of Small-Cap-stock leadership had begun. Almost immediately, the Russell 2000 reversed a big chunk of the prior decade’s underperformance. Unfortunately, that was the extent of the run.
A G-Rated Take On Valuations
In the wake of the 2020-21 mania, any dose of valuation sanity is obviously greeted with eye-rolls. We are going out of our way to present the numbers in the least-shocking way possible.
Waking From A Slumber?
We’re very skeptical that the rally from last October’s low represents the first leg of new bull market. But if it is—as many believe—then it has unquestionably inherited the worst set of genes we’ve ever observed in the species.
Research Preview: Market Narrowness In 2023
The S&P 500 posted an encouraging +9.2% YTD, but below the surface that strong return was the result of a limited number of influences. There is narrowness in both thematic and return drivers; the fact that gains have not been broad-based is cause for concern about performance during the remainder of 2023.
QE Fuels Inequality—Even Among Stocks
We don’t know enough about banking-system mechanics to conclude if the Fed’s balance-sheet increase associated with March’s bank bailout constitutes a new round of QE. But if it is, we’re skeptical equity investors should celebrate it. In fact, those running Small-Cap portfolios should probably fear it!
What’s “Priced In?”
Could the stock market have already discounted a forthcoming recession?
Masquerade Party
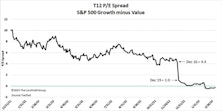
Style investors recently witnessed a rare event when, on February 13th, the P/E ratio of the S&P 500 Growth Index fell below that of the S&P 500 Value Index. At first glance, it is tempting to attribute this valuation flip-flop to the 2022 bear market, which saw Value outperform Growth by a whopping 24.2%. However, the bear-induced collapse of Growth stock prices in 2022 only served to return the P/E spread to a level just below its historical median of 5.1, meaning that the final move toward parity was caused by a force outside the market itself. That “something else” was the S&P 500 style reconstitution that occurs annually on the third Friday of December.
In The “Eye” Of The Beholder
Stocks could trade higher in the next few months as CPI numbers enjoy easy year-to-year comparisons, prompting a more soothing tone in daily Fed-speak. Then again, the lagged impact of the last year’s rate hikes and balance-sheet shrinkage has yet to materialize, meaning we’re likely in the eye of the storm.
The 2021 Speculative Mania And Its Aftermath
One of the societal benefits of recessions and bear markets is that they serve to correct the unhealthy excesses that build up in overheated economic booms and overly enthusiastic bull markets. As market historians, we believe it is instructive to look back at cycles of excesses and their corrections to learn how such patterns evolve and, quite often, repeat themselves.
Valuations: What Bear Market?
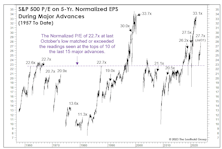
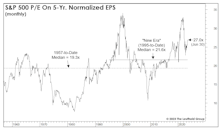
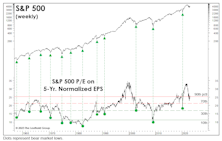
If the October S&P 500 low holds, the normalized P/E ratio of 22.7x on that date will signify the priciest bear market bottom in history; in fact, it is exactly the same level reached as at the August-1987 bull market high. Since October, the normalized P/E multiple has grown to 25.5x—higher than all but three previous bull market peaks.
1966-67: When The Yield Curve “Failed”
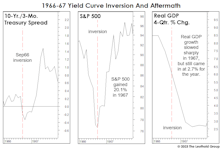
Given the tendency of economists and strategists to dismiss the message of an inverted yield curve, it’s surprising there’s been no scrutiny of the “dog that didn’t bark”—the inversion of 1966. That’s the last time an inverted curve did not lead to a recession.
Is Value Still A Value?
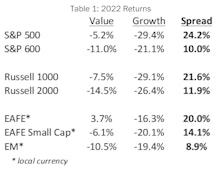
Deflating valuations in the Technology and Innovation space produced ghastly results for growth investors in 2022, with the S&P 500 Growth index experiencing an agonizing 29.4% loss. Meanwhile, last year’s bear market was no more than a mild irritation for value investors as the S&P 500 Value index lost just 5.2%. The collapse in exuberantly priced growth stocks produced a 24.2% return spread between the value and growth styles, which goes into the record books as the second biggest annual win for value since 1975.
A One-Hundred-Year Market Echo
Hopes that this decade might see a repeat of the “Roaring Twenties” took a hit last year. But there’s plenty of time to recover, and bulls will be encouraged to learn that cumulative stock market performance for this decade, thus far, is better than at the same point in the Roaring 1920s.
Tactical Tools For A Stronger Dollar
The 2022 bear market has been driven by collapsing valuation multiples, particularly for expensive growth stocks and unprofitable companies. Coming into the year, U.S. stocks stood as one of the most egregiously valued equity markets around the world, motivating investors to look elsewhere for more reasonably priced alternatives. Fortunately, international stock markets offered much better valuations that could serve as havens from the coming U.S. valuation collapse. Unfortunately, the strategy of seeking refuge in moderately priced foreign markets was foiled by an unusually strong U.S. dollar, leading us to take a closer look at how moves in the USD affect investment outcomes for domestic investors.
Valuation Mirage?
Thanks to the 2009-2021 experience, an entire generation of investors can’t distinguish between a stock market that’s down in price and one that’s actually “cheap.” The current bear market seems on course to make that distinction relevant again.
Thoughts On The Secular Outlook
Some have speculated that 2022 might have been the kick-off for a decade-long era in which the broad stock market indexes will make essentially no progress, like 1966-1982. However, that earlier experience provided opportunities within other market segments, which will also stand a much better chance in coming years.
The 60/40’s Annus Horribilis
The balanced portfolio strategy of allocating 60% to equities and 40% to fixed income generated a highly satisfactory 7.9% annualized return over the last 30 years. Despite the excellent returns earned by investors following this strategic model, the past couple of years have seen a parade of articles with headlines such as “Is the 60/40 Portfolio Obsolete?” and “Is the 60/40 Dead?” Given the central importance of this moderate allocation strategy to investment industry practices, we felt a closer look at the 60/40 portfolio was in order.
Tightening Into A Slowdown: Month Eight
We think the U.S. economy will slip into recession sometime in the next year, but the level of “excess savings” provided by pandemic aid renders the already difficult task of timing more elusive than ever.
Time To Retire The Fed Model?
We’ve heard no references lately to the famous “Fed Model” for stock market valuation. We think we know why: The model’s usual proponents probably don’t like its current verdict—which is that stocks are far more expensive than at the early January market peak.
Another Stab At The “Downside”
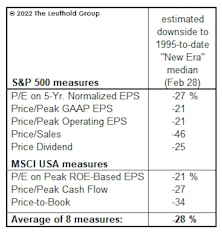
How far might the S&P 500 fall in a recessionary bear market? The 2002 and 2020 stock market lows were both produced by “recessionary” bears; based on history back to the 1920s, those two lows stand out as the priciest bear market bottoms on record—and it’s not even close.
No Rest For The Weary
If there’s a polar opposite to “Goldilocks,” this must be it. Not too hot and not too cold? What about both? Job growth and inflation are hot enough to force the Fed to follow through on its hawkish promises. But the leading indicators continue to warn us of oncoming cold. The odds that the porridge settles at the right temperature, without an intervening recession, look longer by the day.
Valuations: Living Beyond One’s Means?
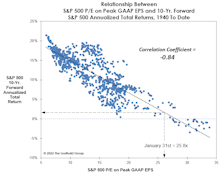
We won’t dispute that investors were not genuinely frightened at the June market lows, or that fears have evaporated following a 13% rally in the S&P 500. The distress is understandable: For 26 traumatizing days in 2022, our S&P 500 Normalized P/E multiple traded below its 1957-to-date top decile!
Bear Market Rallies In Context
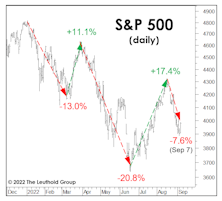
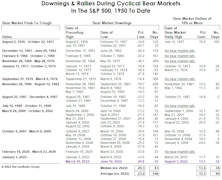
The 2022 bear market is the 13th cyclical bear since 1950, and it’s already joined the mightiest half of its predecessors based on the fact that it’s actually contained a bear-market rally. Six of the prior 12 bear markets weren’t interrupted by even one rally of at least 10%.
“Recessionary” Valuations?
The bear was a mere cub back in March when we examined the historical record of buying S&P 500 dips in the -10% to -12% range. “Blindly” buying them turned out to have mediocre returns, but we illustrated that the positions of various business-cycle indicators could help one determine whether or not catching the proverbial “falling knife” was warranted.
Break Out The Checkbook!
We apologize for that terribly misleading teaser of a title, but the bills for the stock-market mania of 2020-2021 are piling up. Inflation is one of them, lately increasing each month as relentlessly as cable TV used to. And for the 10% of households who own 90% of the stocks, market air-pockets such as June’s are like “surprise” medical bills: There’s rarely just one
“PSsss”
The most brutal bear markets occur when falling earnings are accompanied by shrinking valuations, producing a compound negative effect on stock prices. Investors in 2022 have (so far) avoided this double-whammy in that valuations have taken a hit, but EPS estimates are holding strong. We are intrigued by the notion that 2022’s bear market has, to date, been all about valuation compression rather than earnings weakness. Investors are coping with the problems of the day by letting the air out of bubbly valuations, and this report takes a closer look at the valuation squeeze underlying the current selloff.
The Bear Market In P/E Multiples Rages On
Throughout most of the COVID rebound, market bulls told investors (correctly) to ignore valuations and simply ride the liquidity tide. But with that tide now flowing out (and at possibly its fastest speed ever), guess what the one-time liquidity junkies see as a reason to stay in stocks? Yes, cheaper valuations!
Research Preview: P/E Multiple Compression In 2022
Stock market corrections are the result of falling valuations and/or falling earnings, and when both conditions appear together, investors are in for a rough ride. Thus far, the 2022 selloff has been confined to compressing P/E ratios, and we launched a research project to take a closer look at shrinking stock valuations in this market downdraft.
Some Perspective For Dip Buyers
Losses in the Russell 2000 Growth Index and the NYFANG+ Index have topped 40%, and the only true equity rockstar, spawned by a 13-year secular bull market, has watched her fund’s value drop by more than three-quarters. Yet there’s still a televised debate as to whether this decline is even a bear! Could there be a more devious creature on the face of the planet?
The “Donut” Might Be Healthier Than You Think
Lent ended last week, allowing Christians to resume the intake of unhealthy foods. But rather than a nice, thick T-Bone steak, we’d suggest sampling one of the few items that’s fattened investors’ accounts in 2022—the Donut!
A Tale Of Two CDs
Investors considering a position in the Consumer Discretionary sector need to be aware of what they are buying: a basket in which one-half consists of mature, modestly-valued consumer brands, while the other half is two mega caps with excellent growth profiles and high absolute valuations. It would be a mistake to view this sector as a homogeneous set of companies.
The Bull Visits The Vet
Just after yesterday’s close, we loaded our precocious bull into an SUV and drove to the local veterinary clinic for a two-year checkup.
Our bovine buddy drew some sympathetic stares while we were waiting in the lobby. Noting our bull’s droopy eyelids and gray facial hair, an assistant informed us, “You know, you didn’t actually need to bring him here. We now have a mobile euthanasia service.” We just smiled, and waited for the veterinarian, who is said to be a specialist in this new super-species of bull.
Reversion, But To Where?
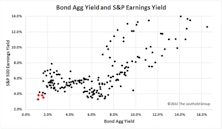
The concept of “mean reversion” used to help build massive fortunes. Of late, a better mantra has been “maximum attraction,” as valuations and bullish psychology have matched or surpassed excesses of the Y2K Tech bubble. Meanwhile, corporate profit margins, once dubbed “the most mean-reverting series in finance” by Jeremy Grantham, have now topped those seen near the Y2K top by more than 50%.
Bubble Or Not? Two Valuation Takes
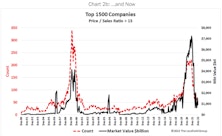
In early 2018, we thought the market was expensive, but certainly not a bubble. Today, the trouble is not just high P/E multiples, but the sustainability of the “E” itself—with profit margins nearly 20% higher than ever before. Whether one believes U.S. Large Caps are engulfed in a bubble or not, we have a P/E ratio for you.








.jpg?fit=fillmax&w=222&bg=FFFFFF)


.jpg?fit=fillmax&w=222&bg=FFFFFF)
.jpg?fit=fillmax&w=222&bg=FFFFFF)

.jpg?fit=fillmax&w=222&bg=FFFFFF)
