VLT Signals
Small Caps: Unresponsive
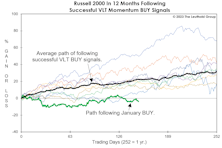
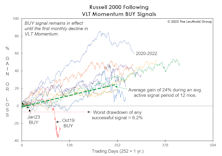
Based on successful Russell 2000 VLT BUY signals, 1982-forward, the index had gained an average of 23% eight months later—and none had a losing position. Since the VLT BUY on January 31st (eight months ago), the Russell 2000 has dropped 3.9%. Furthermore, Small Caps bottomed 15 months ago, and in a normal cyclical bull market, the Russell 2000 would be up 50-70% by this time.
Lowering The Bar!
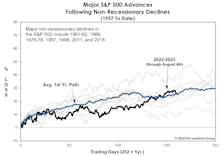
As we’ve noted, none of the major indexes has kept pace with the typical path traced out during past cyclical upswings. It has since occurred to us that this nearly ten-month stock rally is being compared to an unrealistically high standard: The current advance doesn’t have the advantages enjoyed by bulls that launched out of recessionary conditions.
Checking In On The Rally At The Six-Month Point
.jpg?fit=fillmax&w=222&bg=FFFFFF)
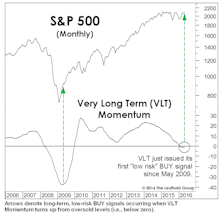
Yesterday was the six-month anniversary of the bear market low of 3,577.03 in the S&P 500. We think it’s unlikely the moderate upswing since then represents a new cyclical bull market. However, with the evidence still weighing in at Neutral, we’re not betting the farm on that opinion.
Small Cap Malaise
Imagine telling a Small Cap investor in mid-2018 that: (1) the U.S. economy would spend all but two months of the next 4-1/2 years in expansionary mode; and (2) M2 money supply would increase by 50% in that time, and yet the Russell 2000 would gain a grand total of just 9% over the same span.
Might VLT Be Out Of Step?
Unless the S&P 500 and NASDAQ correct more than 5% from their March 6th levels by the end of the month, both will trigger new VLT BUYs. Rather than celebrating that prospect, however, we find ourselves wondering what might go wrong.
VLT Update
The progression of bullish technical evidence since October’s S&P 500 low is compelling, though not overwhelming. With that low now almost four months behind us, the VLT Momentum oscillator for the S&P 500 probably “should” have already triggered a new BUY signal. Yet, both the S&P 500 and NASDAQ Composite are still holding out.
VLT: “A Swing” And “A Miss”
We suspected November’s “low-risk” VLT Momentum BUY signal on the Dow Jones Industrials might turn out badly, and we were right: The Dow’s decline last month was enough to cause VLT to roll back over, which officially “rescinds” that signal.
Mixed Messages From VLT

While VLT for the S&P 500 continued to trend lower in November, the DJIA calculation edged higher and triggered a new BUY signal. The message could soon get more confusing: A BUY signal for the Russell 2000 would be triggered if that index closes December above 1,813, while the S&P 500 and NASDAQ would have to climb more than 11% and 15%, respectively, to trigger a VLT BUY.
Supercharging VLT With Small Caps

Leuthold did not invent VLT. The credit goes to Sedge Coppock, a technical analyst who insisted on being called an “econometrician.” While the famed Coppock Curve was based on the Dow Jones Industrial Average, Leuthold found the algorithm useful at the industry group level—it is a component within our Group Selection (GS) Scoring system.
VLT Says Stocks Are Finally Oversold

The 2022 bear market has unfolded in a way that’s finally driven our Very Long Term Momentum algorithm for SPX into oversold territory for the first time since 2016. However, that only means a “low-risk BUY signal” is now mathematically possible—we could be writing about the “impending BUY” for many months to come.
Down—But Not Washed Out

Based on a short-term perspective, stocks may be ripe for a bounce. However, the S&P 500 has not reached “oversold” territory since early 2016, and it is still a long way from doing so. Of the major indexes, only the Russell 2000 is now positioning to soon claim a “low-risk buy” signal.
Down, But Hardly “Oversold”

Historically, a good measure of a fully oversold market has been a drop to negative by our VLT Momentum algorithm. YTD, it has been on the downswing, but is still in the vicinity of its highs reached during the Trump Bump. If the May bottom in the S&P 500 turns out to be the final low for the decline, VLT would be one of many suggesting the new rally is among the riskiest in market history.
Small Cap Smack-Down

We were fooled on Small Caps, and it’s been a “multi-factor” catastrophe.
VLT Complicates The Market Puzzle

At October’s close, a long-term BUY signal was triggered on the Russell 2000. The fact that some market segments are triggering “oversold BUYS” when blue chips are at record highs speaks volumes about the internal disparities that have developed during the last few years. The Russell BUY signal is not inconsistent with our belief that the action since the January 2018 peak remains part of a lengthy cyclical topping process.
The Market Puzzle Gets Even More Complicated

At last night’s close, the Russell 2000 generated a “low-risk” BUY signal on our Very Long Term (VLT) Momentum algorithm, a possibility we’d alluded to in the September and October Green Books.
Small Cap VLT BUY: Not Quite...

Small Caps came tantalizingly close to activating a major VLT BUY signal in September, with the Russell 2000 closing less than a half percent below the trigger level. A new bull signal from this indicator wouldn’t “fit” into our market and economic narrative, but we won’t sweep it under the rug if it occurs.
Small Caps: “What If?”

The Russell 2000 is the most important major index on the cusp of a new BUY signal. Our best guess is that Small Caps will still trend lower for now, creating a buying opportunity in the months ahead.
Portraits Of An Out-Of-Sync Market
We suggested many years ago that the final top to this historic bull market would be a long and complicated process rather than a clean and singular event.
Adding Some Emerging Markets On A “Rent-to-Own” Basis
.jpg?fit=fillmax&w=222&bg=FFFFFF)
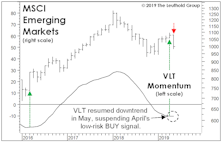
Emerging Market equities have been modest underperformers during the current rally, but they’ve marshaled enough strength to trigger a new low-risk BUY signal on our VLT Momentum algorithm at the end of April.
VLT & Implications For Small Caps

For much of this decade, we had an allocation preference for Large Caps over Small Caps because of the considerable P/E premium commanded by the latter.
Bottom-Spotting In Foreign Stocks

The tale of two markets has existed for years, but now it’s getting ridiculous.
VLT = Very Lousy Timing?

In the spirit of keeping an open mind, three months ago we observed that our S&P 500 VLT Momentum measure had triggered a “moderate-risk” BUY signal with its August reading.
More Upside For Small Caps?

There was a major cyclical BUY signal (VLT Momentum) for the S&P 500 in late-May, and as of July’s close, that bullish development was reinforced by a new VLT BUY signal on the Russell 2000.
VLT Says “BUY”
Breadth underlying the 4-month upswing has been stronger than that observed during any other rally leg since 2013. Despite just a 14% correction in the S&P 500 from its peak, a new VLT “BUY” signal was triggered. Failed signals are relatively rare, the last one occurred in December 2001.
A Turn In Leadership?
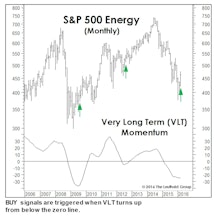
Last month we wrote that a big March gain would trigger a Very Long Term (VLT) Momentum BUY signal on the S&P 500 (Chart). The month’s 6.8% S&P 500 gain wasn’t quite enough to do the trick, but we’re intrigued that VLT did issue BUY signals for three of the market’s cyclical sectors, including Energy, Materials, and Industrials.
VLT Flashes A BUY On Oil
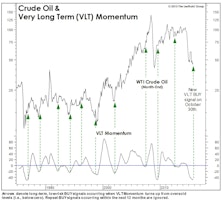
As expected, our VLT Momentum algorithm triggered a “low-risk” cyclical buy signal on crude oil in late October, only the 11th buy signal in the past 30 years. This algorithm was originally designed to identify low-risk entry points into the stock market, but we’ve found it useful with other assets as well.
Perception for the Professional
March 2026 Issue

Featured Articles
Sector Navigator
March 2026 Issue
