Asset Allocation
Multi-Asset: Winning By Losing Less
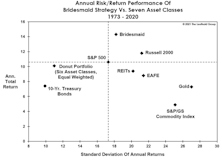
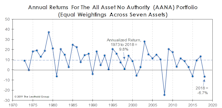
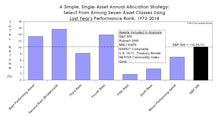
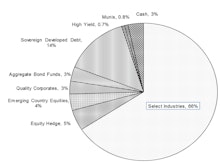
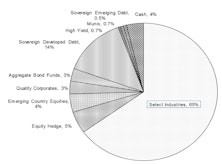
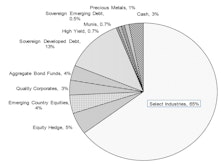
At the beginning of the year, we liked the chances for the “Donut Portfolio” to break its 10-year losing streak against the S&P 500. As a refresher, the Donut holds six of seven key assets in equal weights. The S&P 500 is excluded—a decision probably only suitable for allocators who are self-employed.
“Donuts”—The New Comfort Food
For the last few years, the S&P 500 has been the most richly priced of the broad equity indexes, and its moderate decline, to date, makes it even more so on a “relative” basis. In recognition of that, we began to track the hypothetical allocation strategy of avoiding this index.
Snack Time?
As discussed elsewhere in this section, we had a novel idea for asset allocators tired of chasing the S&P 500: Hop off the treadmill and take a “Donut” break!
“De-Worsification” Ruled In 2018!
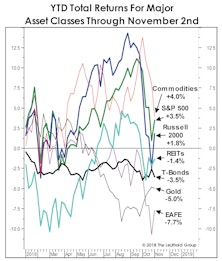
The market difficulties of 2018 were hardly limited to stocks. Commodities, in fact, were the worst performer among the seven major asset classes.
Asset Allocation: As Bad As It Gets
Asset Allocation in 2018 is about as bad as it gets. No major asset class has done well.
Asset Allocation: Buy Strength Or Weakness?
We are contrarians at heart, but learned quickly that successful contrarian investing is far more complicated than simply buying assets that are down the most in price.
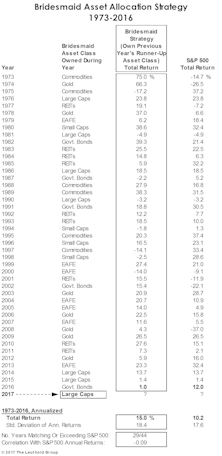
Bridesmaid Track Record
U.S. 10-Year Treasury Bonds—last year’s Bridesmaid holding—eked out a 1% gain in 2016, a disappointing result but one that preserved a streak of positive annual returns dating back to 2001 (Table 2).
Asset Allocation: No Upside In 2015
Hedge funds have shuttered by the dozen in the past few weeks, with the worst carnage among those focused on Emerging Markets and commodities. But the problem is broader.
Asset Allocation: Buy Weakness Or Strength?
Models can prove helpful in overriding an investor’s natural (and frequently costly) impulses. But we’ve come to believe that our long experience in model building and implementation has succeeded not only in overriding these impulses but in actually modifying them.
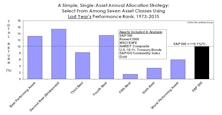
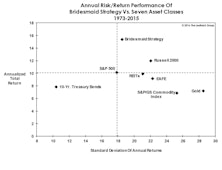
Bridesmaid Asset Strategy
Liquidity “consuming” strategies like price momentum are generally considered to be more volatile than liquidity “providing” approaches like value investing.
Core & Global Asset Allocation Portfolios
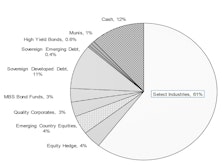
Major Trend Index strengthened in April; net equity exposure increased to 61%
Core & Global Asset Allocation Portfolios
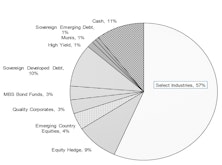
Major Trend Index Neutral: Equity Exposure Remains 52-53%
Asset Allocation & Sector Strategy: Follow The Trend, Or Fade It?
We are nothing if not contrarians, but have also highlighted the hazards of “knee-jerk” contrarianism—in which investors are instinctively drawn to the asset, sector, or stock that is down the most in price in the recent past.
Core & Global Asset Allocation Portfolios
We increased equity exposure back above 50% in mid-November as a result of the MTI returning to Neutral.
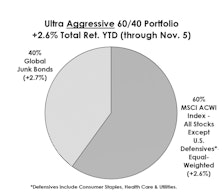
“Fully-Invested Bears” Are The Year’s Big Winners
With the S&P 500 at a double digit gain YTD, one would expect those being rewarded are aggressively positioned. We present two hypothetical portfolios and find the hyper-conservative one has nearly doubled the S&P 500 gain.
Core & Global Asset Allocation Portfolios
Major Trend Index turned negative and as of early October, we are now targeting 40% net equity exposure.
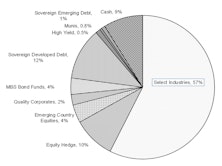
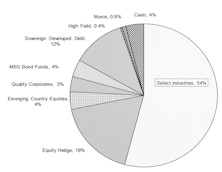
Core & Global Asset Allocation Portfolios Competitive With Benchmarks Despite Maintaining Reduced Equity Exposure
Net equity target is 55%; waiting for clearer signal from our Major Trend Index (currently rated Neutral).
Core & Global Asset Allocation Portfolios’ Net Equity Exposure Unchanged At 65-66%
Both Portfolios lagged all-equity benchmarks in June; but still ahead YTD.
Core & Global Asset Allocation Portfolios’ Net Equity Exposure Unchanged At 65%
Both Portfolios matched their all-equity benchmarks in May, and are outperforming YTD.
Core & Global Portfolios Equity Exposure Unchanged In April
The Major Trend Index remains positive, and our portfolios continue outpacing the market. Net exposure is 65% in both the Core and Global portfolios.
Core & Global Portfolios Equity Exposure Increased Slightly In February
The Major Trend Index remains positive, and net exposure is 65% in the Core and 64% in Global.
Core & Global Portfolios Equity Exposure Maintained In January
The Major Trend Index remains positive and net exposure is 63% in the Core and 62% in Global.
Core & Global Portfolios Equity Exposure Maintained In December
The Major Trend Index remains positive and net exposure in both portfolios is 64%. For all of 2013, our average net equity exposure was 60% in each portfolio.
Buy The Bridesmaid, Not The One Looking To Rebound
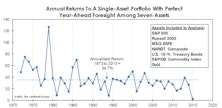
The investment leadership of a given year has historically had better-than-even odds of outperforming in the following year at both the asset class and equity sector levels.
Core & Global Portfolios Equity Exposure Raised Slightly As Hedge Reduced
The Major Trend Index remains positive and, as expected, our temporary ETF hedge was lifted. Our net exposure in both portfolios is now 64%-65%.
Core & Global Portfolios Equity Exposure Trimmed Slightly To 60%
The Major Trend Index remains positive, but we reduced our target exposure from 62% to 60% using a short ETF as we believe this position will be temporary in nature.
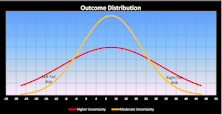
Looking Deeper Into The Tails Of Distribution
Leuthold’s Eric Weigel examines both positive and negative tail risk among asset classes over two time periods… the recent volatile era versus a preceding, not-as-volatile time period.
Buy Prior Year’s Winner, Loser, or Runner-Up?
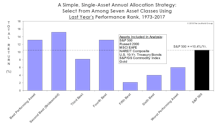
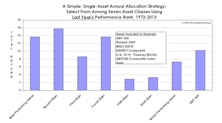
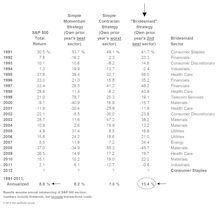
The best strategy has been to buy not the prior year’s top performing sector or asset class, but to buy the runners-up—or “Bridesmaids”— of the prior year.
Asset Allocation: Still Heavy In Equities
Initial outlook for 2010 is to see the S&P 500 rise to 1300 or 1350 during the first half of the year but then give up those gains in the second half of the year. We are counting on the Major Trend Index to help navigate the choppy market.
Not As Bad As January...
First, let us be thankful February 29th only occurs every four years. No, we haven’t done a historical performance analysis of past leap year extra days, but you can be certain somebody now has. Whatever, it was a bad end to February 2008.
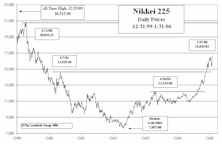
Initiated A Position In Japanese Equities
Used market weakness in Tokyo to begin building position in Japanese equities.
Debunking One Myth Of The Buy And Hold Rationale
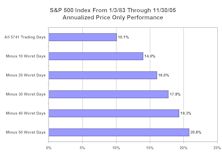
Debunking one myth of buy and hold rationale. Showing how stock market returns change if investors avoid the best and worst performing stock market days. Essentially, anything can be proven with statistics.
A Look In The Rearview Mirror
What we did well and not so well...
View From the North Country
Stock market still considered lead economic indicator? Maybe not, considering the last three years, the stock market has been driven by Main Street. Changing role of portfolio managers: risk management function reduced to minimum if it even exists at all.
View from the North Country
Market timing: key to long term timing success is discipline. Politics 1996: the election outcome that minimizes prospects of decisive political action may provide the best market environment.
In Focus: Paid To Play
The Leuthold Group’s new direction in stock sector selection. A disciplined, unemotional, quantitative approach to today’s “real world” stock market group selection.
Inside The Stock Market
On December 21, the Major Trend Index moved into "neutral" territory.
A Look In The Rearview Mirror
Self examination can be good for the soul, so each January time is taken to look back over the preceding year, critically reviewing the significant studies, portfolio shifts and recommendations appearing appearing in our publication.
The Year That Was
1991 began on a grim note.
A Look In The Rearview Mirror
Self examination can be good for the soul, so each year time is taken to look back over the preceding year or so, critically reviewing the significant studies, portfolio shifts and recommendations appearing in this publication. Including the good...and the bad.



.PNG?fit=fillmax&w=222&bg=FFFFFF)

