Cap Weighted
A Tale Of Two CDs
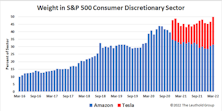
Investors considering a position in the Consumer Discretionary sector need to be aware of what they are buying: a basket in which one-half consists of mature, modestly-valued consumer brands, while the other half is two mega caps with excellent growth profiles and high absolute valuations. It would be a mistake to view this sector as a homogeneous set of companies.
Y2K 2.0?
Cap-weighted valuations for the S&P 500 and S&P Industrials are homing in on the all-time records seen in the first quarter of 2000. We’ll confess that after those valuations collapsed in the years that followed, we thought we’d never see them again in our lifetime—let alone a mere generation later.
Research Preview: A Surprising Dividend Study
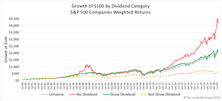
Dividends are a cornerstone of equity investing and, over the decades, they have produced a significant portion of the stock market’s total return. Previous Leuthold research has identified a strong dividend influence on total returns for small and mid-caps; a client recently asked if we found the same effect in the universe of S&P 500 companies. Specifically, have S&P 500 dividend-payers outperformed non-payers, and, second, have dividend growers outperformed non-growers?
Superhuman Feats Got Us Here
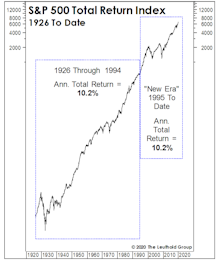
The simultaneous “New Era” ascension in margins and P/E ratios hasn’t generated anything exceptional from a return perspective. To the contrary, annualized S&P 500 total returns over this 25-year period of margin magic and (mostly) escalating P/E ratios merely match “Old Era” returns.
Seasonality And Market Breadth
While the FANGs—and, lately, the Dow stocks—are the market’s undisputed leaders, it’s difficult to argue the market has narrowed in a fashion that’s indicative of a “distribution” phase.
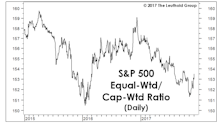
Market Breadth Has Yet To “Lie” Down
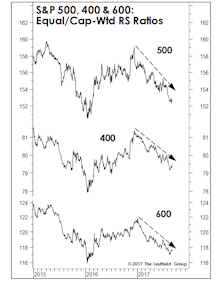
We shouldn’t bite the hand that feeds us, but it’s easy to lie with charts.
The Valuation “Time Clock” Revisited
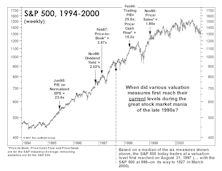
Based on a median of six measures, today’s S&P 500 valuation profile equates to the one prevailing on August 31, 1997. From there, the S&P 500 rallied >60% over the next 2 1/2 years before peaking. However, the same can’t be said of valuation readings for the “typical” or median stock.
A Good Year For Leuthold Industry Group Scores

Last year was a solid one for the Group Selection (GS) Score approach, with the Attractive list delivering a total return of +13.1%—more than 500 basis points above The Leuthold Group Universe average, which gained only +7.9%.
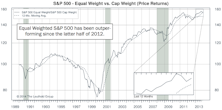
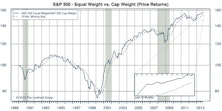
S&P 500: Equal Weighted Index Slightly Better in January
.png?fit=fillmax&w=222&bg=FFFFFF)
The Equal Weighted Index has outperformed the Cap Weighted Index in seven of the last nine months.
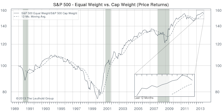
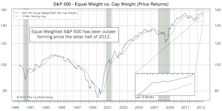
S&P 500: Equal Weighted Index Better in 2013
For 2013, the Equal Weighted Index bested the Cap Weighted Index by 4%. The Equal Weighted Index has outperformed the Cap Weighted Index in four of the past five years.
S&P 500: Cap Weighted Outperforms For The Second Month In A Row
During November the Cap Weighted S&P 500 (+2.8%) outperformed the S&P 500 Equal Weighted (+2.1%) for a second consecutive month.
S&P 500: Cap Weighted Outperforms During October
The Cap Weighted S&P 500 (+4.5%) slightly outperformed the S&P 500 Equal Weighted (+4.2%) during October. YTD, the spread between these two indices remains wide, with the Equal Weighted index outperforming by 4.2%.
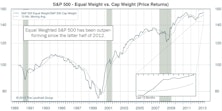
S&P 500: Equal Weighted Outperforms In Q3; Maintains Lead YTD
On a YTD basis, the spread between these two indices continues to expand, with the Equal Weighted index now outperforming by more than 4%. Consumer Staples is the most expensive sector among Large and Mid Caps, while Health Care is most expensive in Small Caps.
S&P 500: Equal Weighted Outperforms During July
The Equal Weighted S&P 500 (+5.4%) outperformed the Cap Weighted S&P 500 (+4.9%) and also continues to outperform on a YTD basis.
Weighted Versus Unweighted: Inside The S&P 500
In 2006, the capitalization weighted S&P 500 was up 13.6%, excluding dividends. The average return for the 500 stocks (S&P equally weighted) was up 14.2%.
Did You Have The Right Mix In 2005?

2005 Performance Recap: Equities, Fixed Income, Large Vs. Small Caps, Weighted Vs. Unweighted S&P 500, Industrial Metals and AdvantHedge.
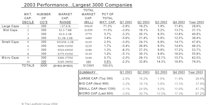
Large Cap Versus Small Cap

Small caps continue to be the market leaders over large caps. This trend is expected to continue into 2005, as our small cap leadership model has recently improved, and is now rated slightly positive.
Equity Performance By Market Cap Tiers
Weighted versus Unweighted S&P 500 comparison, Russell 2000 versus S&P 500 annual comparison and 2003 equity performance by market cap tiers.
Answering Client Questions

Many of the questions in this month’s issue came from January client meetings in Texas.
1999 Performance: Big Caps Versus Small Caps

Small cap performance actually nosed out Big Cap +19.6 for Russell 2000 and +19.5% for S&P 500 (price only). Who would have believed it?
Will Active Management Ever Beat the S&P 500?

It will happen again! Relative overweights in small caps will be an advantage instead of disadvantage to portfolio managers. Small caps can grow earnings faster.
Perception for the Professional
March 2026 Issue

Featured Articles
Sector Navigator
April 2026 Issue
