Cycle Peak
The LEI Clock Is Ticking
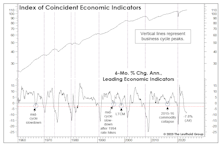
A contraction of 3% or more in the LEI’s six-month annualized rate-of-change has always been associated with a recession, with an average lead time of four months. Using that guideline, the most recent recession warning was triggered in June 2022, and the lead time is now approaching the longest ever recorded (16 months in 2006-07). If today’s lead time matches the 2006-07 experience, the business-cycle peak will occur in October.
Has The Stock Market “Eased?”
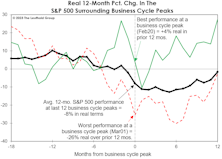
The path of real stock prices in the current cycle looks very different from the typical pre-recessionary track. In fact, based only on the chart of performance in real terms since January 2022, we’d probably believe the economy has recently emerged from recession.
Job Market Deja Vu
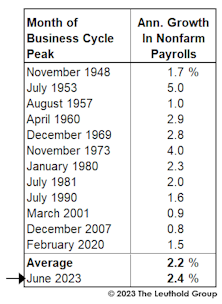
With leading economic measures still trending down, optimists who advocated against fighting the Fed during the free-money era have ditched their own advice. Their focus is now on lagging indicators, like the employment numbers—but that last bastion of strength seems ready to buckle.
Watching The Wealth Effect
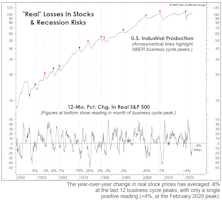
“Real” stock-market wealth has declined considerably since late 2021 without yet delivering a knockout blow. But if the other key evidence detailed throughout this section is on the mark, that wallop is lurking in the very near future.
Normalizing The Abnormal?
In recent years, we’ve supplemented our longstanding normalized earnings technique with the simpler method of referencing any past peak in EPS (or, for that matter, trailing peaks in other corporate fundamentals, like cash flow and sales per share).
The Economy Rallied In January, Too
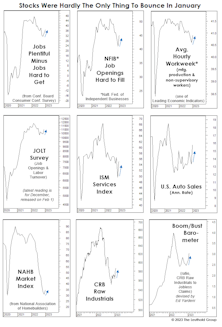
The narrative for January’s strong stock market bounce is that not all key economic releases looked to be forecasting a recession. However, one must consider that this was only true for coincident and lagging data series.
The Yield Curve And The Problem Of Timing
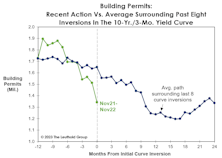
Frequently, there’s money to be made in the stock market in the months following the initial curve inversion. After the inversions of August 2006 and June 2019, the S&P 500 rallied another 23% and 19%, respectively, into its final bull market high. If this cycle plays out in textbook fashion, the business-cycle peak would arrive in September.
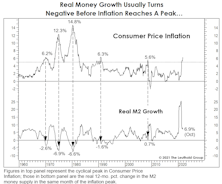
More Signs Of Peak Inflation
As suggested in our June 24th, Chart of the Week, the peak in consumer inflation (+8.6% in May) has likely either occurred or is imminent. Consumers should thank the stock market, which in 2022 has taken up its occasional role as inflation-fighter after the Fed abdicated throughout 2021.
Hello To The Roaring Thirties?!
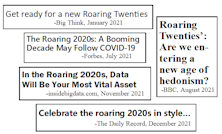
The ink hadn’t dried on 2020’s PPP checks when pundits began speculating that the new decade could be a repeat of last century’s “Roaring Twenties.” That’s become a popular view after a booming 5.7% real GDP growth and a nearly 30% stock market gain in 2021. Just how popular? Analysts are already extrapolating their bullish views into the 2030s!
A 2023 Inflation Peak?
We don’t profess to be professional inflation forecasters, but are struck by a sort of “temporal” mismatch in the arguments used by those who believed the inflation pick up would be temporary. Specifically, the most commonly-cited bullish inflation arguments have been secular in nature, based on long-term trends in technological innovation, demographics, and free trade.
“Peak Insanity” Is Behind Us
We think 2021 has earned its place in the books as the wildest and most speculative year in U.S. stock-market history, eclipsing even 1929 and 1999. That doesn’t mean 2022 will bring a panic or a crash, maybe just a degree of sobriety.
The EPS Recovery And "The Cycle"
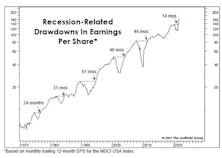
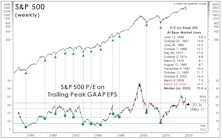
In a couple of weeks, final second quarter EPS for the S&P 500 will confirm the fastest recovery ever from a recession-related earnings decline. That’s old news, and before it has even hit the tape. But we’ve had a sneak peak from the monthly, 12-month trailing EPS numbers published by MSCI for its USA Large Cap Index. Those figures showed that EPS exceeded their pre-COVID peak in May, and the latest reading (through August) is already 22% above the prior high! Simple trendline analysis suggests that EPS for U.S. Large Caps are likely higher today than they would have been in the absence of the COVID pandemic and hyper-stimulative response.
The Inflation Surge In Context
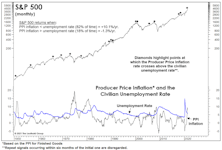
Inflation is already “too high” for the current cyclical setting, and the level of inflation that equity investors are willing to tolerate will drop further as the economy recovers.
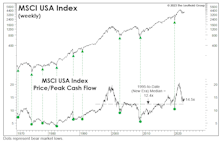
A Pricey Alternative To The S&P 500?
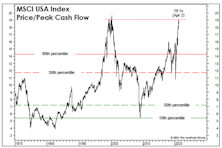
This month we focus on the valuations of the MSCI USA Index—which is nearly identical to the S&P 500. This is worth following mainly because the folks at MSCI are kind enough to provide us with much longer-term histories of Cash Flow and Book Value Per Share.
The Use And Abuse Of Corporate Debt
U.S. corporations piled on almost $1 trillion in debt over the first six months of the year (a 10% increase). Corporate debt has now surged to 56% of GDP. We’ve argued that the level of corporate debt isn’t the problem, in and of itself. Rather, it’s what this debt has failed to generate that is the real problem.
Calculate The Next Low... With The Last Peak?
How does one value a stock market in which 12-month forward EPS estimates show their widest dispersion in history? A good start might be with methods we use when forward estimates show practically no dispersion (like three months ago). In either case, we place little weight on such estimates; each revision usually has only marginal impact on our 5-Year Normalized EPS.
Perception for the Professional
March 2026 Issue

Featured Articles
Sector Navigator
March 2026 Issue
