DJ Transports
The “Transportation” Divergence
.jpg?fit=fillmax&w=222&bg=FFFFFF)
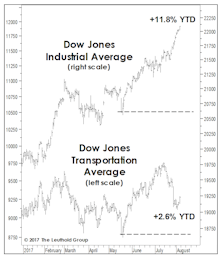
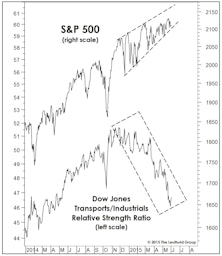
The Dow Jones Transportation Average has recently notched fresh all-time highs. Following a sizable relative performance dip earlier in the year, the Transports’ relative strength has recovered and moved to new 2020 highs (Chart 1). Still, compared to the broad market, the index’s YTD return appears fairly unremarkable, outpacing the S&P 500 by about 3%.
This Is A Head-Scratcher
The longest and probably most complex bull market in history is not going to make a clean and decisive exit.
Troubling Transports?
Does the last few weeks’ stumble in the Dow Jones Transportation Average foretell anything sinister? Not on the face of it.
“Four On The Floor”
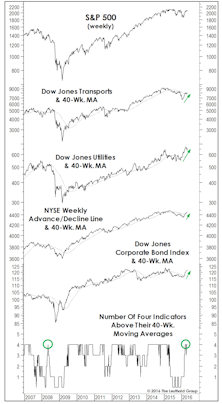
Leadership, breadth, and corporate credit all staged intermediate-term breakouts, rising above their respective 40-week moving averages. In this formation, historically, S&P 500 annualized return is +15%.
Deciphering The Transports’ Message

The Dow Jones Transports was the first U.S. index to top in this cycle (December 31, 2014), and it closed January 7, 2016 down 24.1% from that historic high. That development, in and of itself, sharply increases the odds that a new cyclical bear market is underway.
“Transported” To Safety?
Transportation stocks have confounded conventional wisdom about their presumed relationship with oil during the past three years.
Weakening Foundation
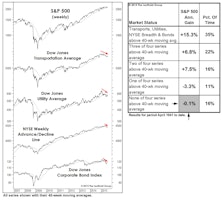
Over the last few months, we’ve presented a couple of simple quantitative studies meant to encapsulate the factors driving our Major Trend Index to the brink of bear territory. The chart and table might provide the best summary yet.
A BUY Signal That Says SELL?
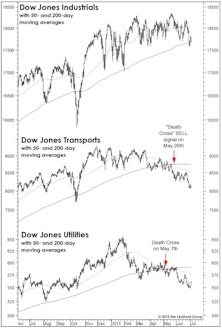
Last month we discussed the negative market implications of May’s “Death Cross” signals in the Dow Transports and Dow Utilities.
Transports Still Troubling
The Dow Jones Transports lagged the market badly again in May, and continues to stand tallest among the red flags we’re now monitoring.
The Double Death Cross!

The Dow Transports and Dow Utilities both triggered major sell signals in May when their 50-day moving averages fell below their 200-day moving averages… known by some as a “Death Cross.”
Charts That Challenge Us…

While our disciplines continue to turn up enough bullish evidence to keep us cautiously positive toward stocks, we are seeing troubling signs by cyclicals (especially the Transports) and junk bonds.
New Laggards On The Radar Screen

Transports now find themselves in a three-month RS downtrend; it’s too early to tell if this is an important message. Leading up to 14 of the last 16 bull market tops, Transports underperformed for a six to 12-month period prior to the final bull market high.
Transports Still Leading - Market Top Not Imminent
While stock market action YTD has not been quite as “uniform,” the hallmarks of an imminent bull market top are simply not present. The bullish portents apply to intermediate term results, however, they cannot rule out any short-term setbacks (which can appear with no tip-off from breadth or leadership measures).
Strength In Transportation: A Deeper Dive
Bull markets rarely come to an end prior to the Transports exhibiting weakness. Their outperformance continues this year, returning an impressive +9.9% through June 4th, almost doubling the S&P 500’s +5.2%. We examine the underlying Transport groups and assess which areas are providing the strength to help sustain the Transportation Index’s leadership.
Is There Trouble In The Transports?
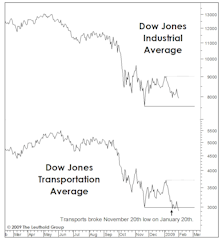
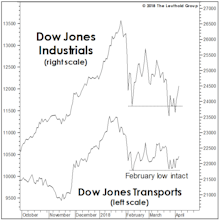
The new low in the Dow Jones Transports is a bullish portent, but only if the Dow Jones Industrials can hold above their November low.
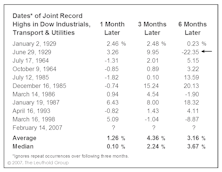
Technical Comment: No Worries Over “Dow Theory?"
Dow Theorists looking at current market environment may be concluding stocks could weaken further. However, historically when confirmation from the Transports takes an excessively long time to develop (like it has currently), the technical pattern has actually provided an excellent buy signal.
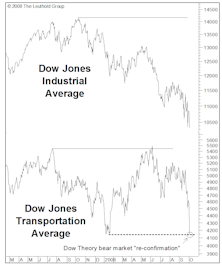
Breadth & Leadership: Bull Markets Rarely (S)Top On A Dime
Market breadth moved down in tandem with stock market indices, but is not showing any divergences. All advance/decline lines were making new highs just before the downturn, and bull markets do not end with advance/decline data posting new highs.
Transportation Stocks As Economic Warning Signal
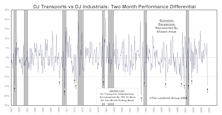
Six of eight recessions since 1957 saw signals registered by the Transportation Divergence monitor. Recent divergence may be warning of an impending economic contraction.
Perception for the Professional
March 2026 Issue

Featured Articles
Sector Navigator
April 2026 Issue
