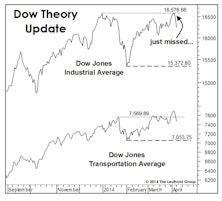
Dow Theory
Testing The Transports
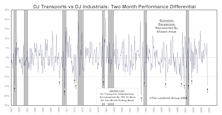
A new market high that is not confirmed by the stocks of companies that “move the goods” is a warning signal. We reviewed the Transports’ action in all years the S&P 500 accomplished a 12-month high during the month of July, like it did this year.
Improving Indicator Evidence
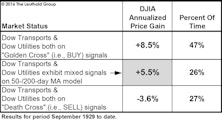
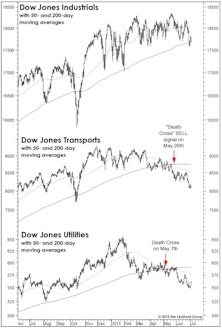
Last spring’s “Double Death Cross” in the Dow Transports and Dow Utilities had been partially reversed even before the February low, when the Dow Utilities’ 50-day moving average crossed above its 200-day moving average (thereby issuing a “Golden Cross”). The Dow Transports remain in a bear pattern based on the 50/200-day relationship, but the gap is closing fast.
New Month, Old Worries...

While the S&P 500 had erased all but 2% of its August loss as of early December, Small Caps and the “average stock” had recouped only about half their correction losses. Not good.
A BUY Signal That Says SELL?
Last month we discussed the negative market implications of May’s “Death Cross” signals in the Dow Transports and Dow Utilities.
The Double Death Cross!

The Dow Transports and Dow Utilities both triggered major sell signals in May when their 50-day moving averages fell below their 200-day moving averages… known by some as a “Death Cross.”
Stock Market Observations

DJIA eclipsed its year-end closing high; Dow Transports still strong; NYSE A/D Line hits all-time high.
U.S. Markets See Uniform Strength, While The World Seems Fractured
Based on the historical percentages, the bull market should have a minimum of four to six months of life left. But the market has a way of throwing sand in the gears when you think you’ve begun to understand its internal mechanics.
Little To Complain About
From a pure price action perspective, it’s difficult to find cracks in the bull market’s edifice.
The Economy And Earnings
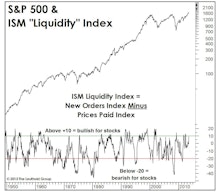
The YTD surge of 19% in the S&P 500 should ensure a stronger second half economy, and the big five-point jump in the latest Purchasing Managers Survey (ISM) might be the first evidence of this.
Ten Charts To Chew On

There are twelve critical indexes (using Big Ten math) that have failed to “confirm” September’s new cyclical bull market highs in the S&P 500 and Dow Jones Industrials.
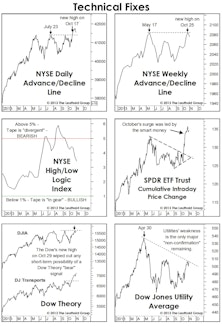
Technical Glitches

This summer’s rally has taken stocks to the brink of another bull market high, but it has not been an all-inclusive affair. While the NYSE Daily Advance/Decline Line has remained healthy, other technical indicators have not.

Major Trend More Bearish As Market Enters Historically Weakest Month

August turned out to be a very volatile month, not the “doldrums” that many investors would have wanted to see during this traditional summer vacation month. Budding optimism that had developed in investors back in April has now apparently been completely washed out by the poor August performance.
Stocks And Economy Joined At The Hip… For Now

Economic indicators are hypersensitive to even small changes in the data, and investors are hypersensitive to the indicators themselves.
Back To A Less Aggressive Equity Exposure

The “Fail-Safe” was triggered by the poor market action at the end of February, and we are moving towards a 50% net equity exposure. Caution seems prudent despite the Major Trend Index remaining in positive territory.
Is There Trouble In The Transports?
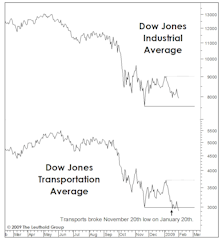
The new low in the Dow Jones Transports is a bullish portent, but only if the Dow Jones Industrials can hold above their November low.
Technical Comment: No Worries Over “Dow Theory?"
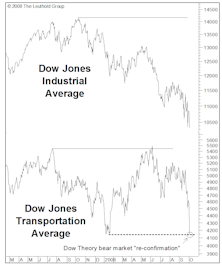
Dow Theorists looking at current market environment may be concluding stocks could weaken further. However, historically when confirmation from the Transports takes an excessively long time to develop (like it has currently), the technical pattern has actually provided an excellent buy signal.
Dow Double Trouble
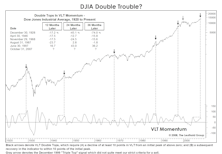
Our VLT (Very Long Term) Momentum algorithm—alternatively known as the Coppock Curve or “Madness of Crowds”—has just rolled over after forming a rare “double top” formation. Why has the rare VLT Double Top typically proven lethal for the stock market?
Transportation Stocks As Economic Warning Signal
Six of eight recessions since 1957 saw signals registered by the Transportation Divergence monitor. Recent divergence may be warning of an impending economic contraction.
Perception for the Professional
March 2026 Issue

Featured Articles
Sector Navigator
March 2026 Issue
