Downside
Hot Under The Collar
If uncertainty is the bane of investors everywhere, then the fear of large losses in a bear market is the boogeyman hiding in the closet. The threat of an agonizing downturn often leads investors to carry lower equity weights in their balanced portfolios than might be advisable, and even drives them to hold excess cash to avoid the risk of sizable declines.
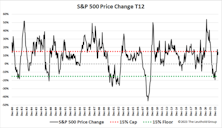
ETF families have responded to this anxiety with a fund design that takes some downside risk off the table and may enable investors to tiptoe into equities even when they suspect a selloff might be around the corner. Known as “buffer”, “defined outcome”, or “target outcome” funds, these ETFs utilize an options collar overlay to trim the upside and downside tails of the underlying asset’s return distribution, thereby giving nervous investors a more comfortable way to pick up some equity exposure during riskier times.
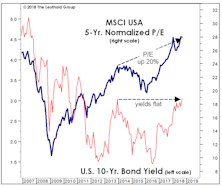
Valuation Mirage?
Thanks to the 2009-2021 experience, an entire generation of investors can’t distinguish between a stock market that’s down in price and one that’s actually “cheap.” The current bear market seems on course to make that distinction relevant again.
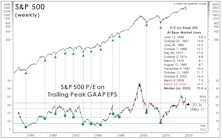
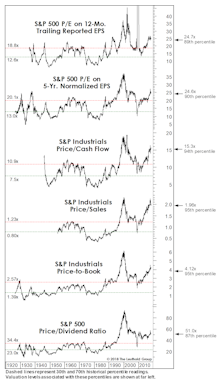
A Valuation Check-Up
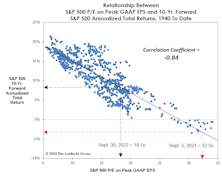
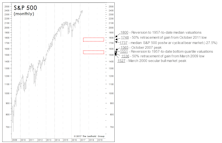
The P/E multiple on Trailing Peak GAAP EPS has plunged 44% from its year-ago peak of 32.5x. The current ratio of 18.1x is below its “New Era” median (1995-to-date) —but some conditions characterizing the New Era no longer apply.
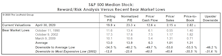
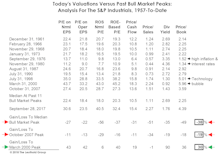
Another Stab At The “Downside”
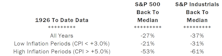
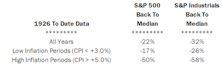
How far might the S&P 500 fall in a recessionary bear market? The 2002 and 2020 stock market lows were both produced by “recessionary” bears; based on history back to the 1920s, those two lows stand out as the priciest bear market bottoms on record—and it’s not even close.
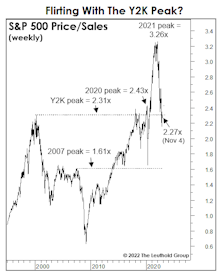
How It Is—And Isn’t—Like Y2K
We previously promised to limit the amount of comparisons to Y2K, but the paths that a number of the usual suspects are taking look more and more like “something we’ve seen before”—in some cases down to the percentage point.
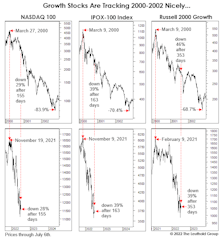
How It Is, And Isn’t, Like Y2K
.jpg?fit=fillmax&w=222&bg=FFFFFF)
The 2022 economic backdrop is nothing like the near-Goldilocks environment accompanying the first few innings of the Y2K Tech bust. However, the action to-date in the former Growth stock leaders has followed the 2000-2002 path very closely—and almost on a point-for-point basis, when it comes to some indexes. With the stock market “weight of the evidence” still negative, we wouldn’t be surprised if the Y2K analog holds for a while longer.
Too Early To Buy?
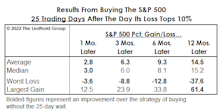
Many investors will instinctively salivate at lower prices, whether or not they represent good value. Is there a better way to temper this Pavlovian impulse and improve results? We found it’s better to wait 25 days before re-entering the market after a 10%-correction threshold is breached.
Reversion, But To Where?
The concept of “mean reversion” used to help build massive fortunes. Of late, a better mantra has been “maximum attraction,” as valuations and bullish psychology have matched or surpassed excesses of the Y2K Tech bubble. Meanwhile, corporate profit margins, once dubbed “the most mean-reverting series in finance” by Jeremy Grantham, have now topped those seen near the Y2K top by more than 50%.
Even “True Believers” Should Read This
Consider it a sign of the times: Here is the most bullishly slanted version of our “Estimating The Downside” exercise we’ve ever put in print (and likely ever will).
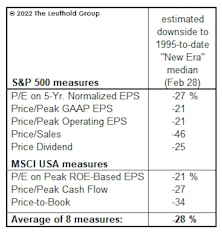
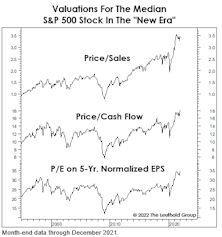
New Era Valuations?
We understand the various rationale for the upward shift in equity valuations seen over the last quarter century or so. Unfortunately, wiping away all market history prior to 1995 does not make stock valuations appear significantly less inflated.
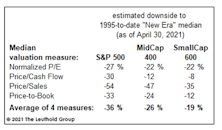
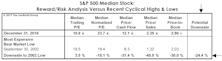
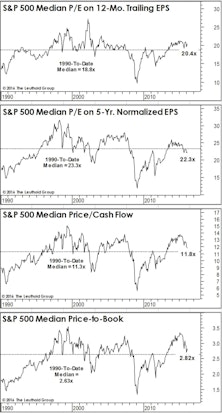
Median Valuations: Down, But Not Cheap
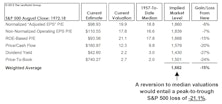
If we assume that valuations will “bottom” at the “richest” levels ever seen at a bear market low, there’s still 32% downside remaining in the median S&P 500 stock.
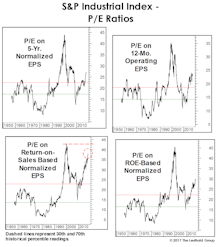
Calculate The Next Low... With The Last Peak?
How does one value a stock market in which 12-month forward EPS estimates show their widest dispersion in history? A good start might be with methods we use when forward estimates show practically no dispersion (like three months ago). In either case, we place little weight on such estimates; each revision usually has only marginal impact on our 5-Year Normalized EPS.
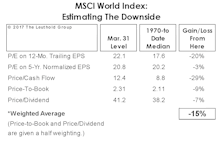
Are Foreign Stocks Cheap Enough?
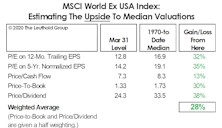
For those who must remain fully invested, an interesting (if not sickening) feature of the bear market is that those who entered it loaded with the most expensive and “trendiest” stocks and sectors have lost the least.
Estimating The Downside

With the markets in freefall, we’ve seen a dramatic spike in interest in our monthly “Estimating the Downside” vignette. We think a mid-month snapshot is in order to give some idea as to how much meat has been taken off the valuation bone.
Guess-timating The Downside
While our market disciplines remain negative, we certainly aren’t oblivious to the haircut in equity valuations that’s already occurred.
Correction Creating Values?
.jpg?fit=fillmax&w=222&bg=FFFFFF)
While the consensus view remains that October’s stock market rout was “healthy” and “overdue,” we think it was more likely the first leg down of much larger decline. But it’s still worth reviewing the improvement in valuations that market losses and this year’s excellent fundamentals have combined to produce.
The Two-Tiered Global Market
We should emphasize that our characterization of stocks as dangerously overvalued applies only to the U.S. market.
Estimating The Downside: The G-Rated Version
The longevity of this bull market is impacting tactical asset allocators in ways great and small.
An Old Chart Whose Time Has Come?
No, it’s not a 1990s-like love affair with the stock market. But it’s surely a sign of the times when TV pundits seem to have dropped even passing references to valuation when spinning their mostly bullish market yarns.
Dialing In On Downside Risks
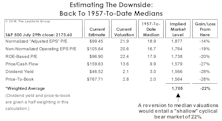
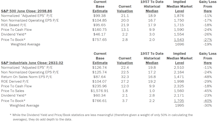
Question: Your “Estimating The Downside” section shows the S&P 500 would lose 26% if it reverts to its 1957-to-date median valuation level. The downside estimate for the S&P Industrials Index, however, is almost -40%. Why such a huge difference?
Estimating The Downside
We remain cyclically bullish on equities, but nonetheless like to engage in occasional downside “target practice” to shape our expectations for the next bear market.
Don’t Call It A Bubble
Thanks to reasonable valuations outside the United States, our work finds global equities only moderately above their long-term valuation norms.
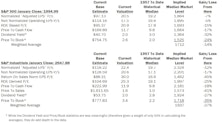
Estimating the Downside - February 2017
The S&P 500 gained 1.9% in January. Based on the 1957-to-date valuation metrics presented, the potential downside compared to its historical average remained the same as last month’s reading (-21%).
Foreign Equities: Cure For Altitude Sickness?
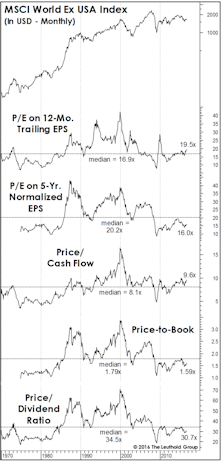
When we complain about the stock market’s inflated valuation levels, we’re unintentionally giving short shrift to the 50% of the global-market capitalization that resides outside the U.S. We’d be hard-pressed to describe the valuation of Developed foreign markets as any higher than neutral.
Bubble Or Not?
To revisit the all-time valuation peak of March 2000, the S&P 500 would have to reach 3455 (not a forecast!). A reversion to 1957-to-date median valuations implies an S&P 500 loss of 22%. That’s a serious loss, but hardly on the order of a “busted bubble.”
Estimating the Downside - July 2016
Back to the medians (1957 to date): S&P 500 19% downside.
Another Look At Median Valuations
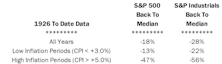
While the past several months’ reversion in valuation measures has certainly wrung some of the risk out of the market, if the bear market reasserts itself and drives stocks to valuations seen at average cycle lows, downside risks are still substantial.
Estimating the Downside - February 2016
The S&P Industrials’ downside to mean valuation (excludes Utilities and Financials) is 24%, about 3% less than last month’s reading.
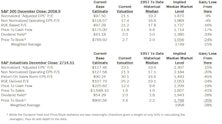
Estimating the Downside - January 2016
The S&P 500 lost 1.8% (price only) in December. Based on the 1957-to-date valuation metrics presented, downside to its historical average decreased by about 2% from last month’s –19% reading.
Estimating The Downside
Following August’s market break, we produced a set of potential downside targets derived from a mix of technical retracements, “average” bear market declines, and an assumed reversion-to-the-median in S&P 500 valuations. Little has changed here.
Estimating the Downside - November 2015
BACK TO THE MEDIANS (1957 To Date): S&P 500 18% Downside
The S&P 500 gained 8.3% (price only) in October. Based on the 1957-to-date valuation metrics presented below, downside to its historical average increased by about 6% from last month’s –12% reading. The S&P Industrials’ downside to mean valuation (excludes Utilities and Financials) is 30%, about 3% greater than last month’s reading.
How Far Could It Fall?
"Oversold" Doesn't Mean BUY
Estimating The Downside - February 2015
The S&P 500 lost 3.1% (price only) in January. Based on the 1957-to-date valuation metrics presented below, downside to its historical average decreased by about 1% from last month’s reading of –15%.
Estimating The Downside - January 2015
The S&P 500 lost 0.4% (price only) in December. Based on the 1957-to-date valuation metrics presented below, downside to its historical average decreased by about 1% from last month’s reading of –16%.
Broadly Expensive — Downside To Past Market Highs (And Lows)
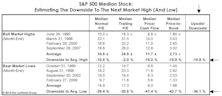
The median S&P 500 stock is now expensive enough that we’re able to estimate its potential downside to prior bull market highs! Based on an average of four valuation measures, the median stock needs to drop about –11% to match the typical valuations at the eve of a cyclical bear market.
Estimating Downside - October 2013
The S&P 500 gained 3.0% (price only) in September. Based on the valuation metrics presented in the table below, the S&P 500 has 9% downside to reach its historical average. The S&P Industrials (excludes Utilities and Financials) now has 22% downside to reach mean valuation.
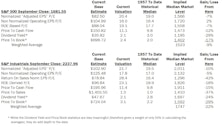
Estimating The Downside - September 2013
The S&P 500 lost 3.1% (price only) in August. Based on the valuation metrics presented in the table below, the S&P 500 is 8% above its historical average. The S&P Industrials (excludes Utilities and Financials) now has 20% downside to reach mean valuation.
Estimating The Downside - August 2013
The S&P 500 gained 4.9% (price only) in July. Based on the valuation metrics presented in the table below, the S&P 500 is 12% above its historical average. S&P Industrials (excludes Utilities and Financials) now have 21% downside to reach mean valuation.
Profit Margins In Retreat....The Mathematics Of The Downside
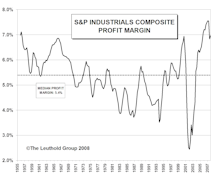
Profit margins contracting. Assuming margins fall back to median historical levels, this implies a market decline of about 18%.
Perception for the Professional
March 2026 Issue

Featured Articles
Sector Navigator
March 2026 Issue
