EPS
Sliced Breadth
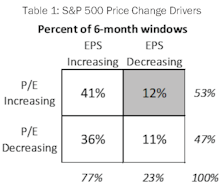
The S&P 500 posted a 7.7% price gain for the six months ended April 30th, although this advance has been a hard-fought battle as gains have resulted from a narrow list of drivers. Style leadership has been concentrated in mega-cap tech names, such that the ten members of the NYSE FANG+® Index have produced 77% of the S&P 500’s YTD gain. Furthermore, gains over recent months have resulted solely from expanding multiples. Narrowness in either thematic leadership or price drivers is concerning because breadth is a useful concept in evaluating the staying power of a market advance. In light of this year’s market action, we are intrigued by the notion of measuring breadth not simply by price moves alone but by examining each of these two important sub-components individually. Does today’s environment, where price gains are driven by valuation increases alone, tell us anything about future market returns?
Research Preview: Market Narrowness In 2023

The S&P 500 posted an encouraging +9.2% YTD, but below the surface that strong return was the result of a limited number of influences. There is narrowness in both thematic and return drivers; the fact that gains have not been broad-based is cause for concern about performance during the remainder of 2023.
Earnings: Reversing The “New Normal?”
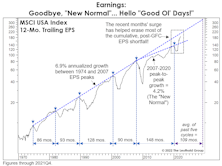
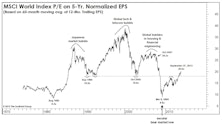
If earnings’ nearly vertical ascent continues for another six months, 12-month trailing EPS will intersect the 6.9% long-term-growth trend line connecting the five major EPS peaks between 1974 and 2007. The “New Normal” has given way to the “Good Ol’ Days!”
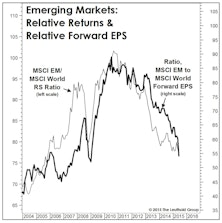
Emerging Markets EPS: There's Many A Slip...

If there is one thing sure to make equity investors swoon, it is the prospect of buying into a credible, long-lived secular growth story at a relatively modest valuation. Over the past three decades, Emerging Markets (EM) have proffered just such an opportunity. EM’s economic growth rates have far surpassed those of developed nations, and the valuations attached to EM stocks have often been at a discount to other markets.
However, this combination of secular growth and attractive valuations has not always paid off for investors. The MSCI Index has underperformed the U.S., Europe, and even Japan over the last ten years in local currencies. Furthermore, EPS growth for the EM Index has come in far below its economic growth rate, creating an exasperating drag on Index performance as it tries to keep up with other regions.
Valuations And The Earnings Recovery
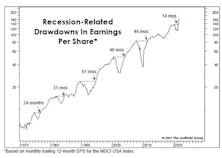
Analysts at Standard & Poor’s will soon confirm what’s been known for several months: The earnings downturn associated with the COVID recession was the shallowest and shortest of any recession-related EPS decline.
Research Preview: Emerging Markets’ Leaky Bucket

Investors view Emerging Markets (EM) as the best source of economic growth across global equity markets, and rightly so. Annualized EM GDP growth of 8.6% since 2001 is more than double that of the U.S. and Europe. However, investors have not captured this extraordinary advance because earnings per share for the MSCI EM Index have lagged far behind EM economic growth rates.
The EPS Recovery And "The Cycle"
In a couple of weeks, final second quarter EPS for the S&P 500 will confirm the fastest recovery ever from a recession-related earnings decline. That’s old news, and before it has even hit the tape. But we’ve had a sneak peak from the monthly, 12-month trailing EPS numbers published by MSCI for its USA Large Cap Index. Those figures showed that EPS exceeded their pre-COVID peak in May, and the latest reading (through August) is already 22% above the prior high! Simple trendline analysis suggests that EPS for U.S. Large Caps are likely higher today than they would have been in the absence of the COVID pandemic and hyper-stimulative response.
The 2021 EPS Rocket Ship
.jpg?fit=fillmax&w=222&bg=FFFFFF)
If you want to see a rocket ship, there’s no need to crane your neck upwards to see the latest exploits of our billionaire space cowboys. Rather, look to our earnings glidepath chart and marvel at the contrails of the 2021 full year operating earnings for the S&P 500.
The Bull Is Dead, But The Leaders Live On
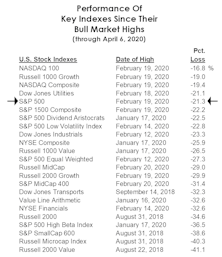
The bull market of 2009-2020 is no longer. But its spirit—its leadership—has somehow lingered, right through the worst of the decline and during the eleven-day, +19% S&P 500 bounce that followed.
Giving Up The Ghost
.jpg?fit=fillmax&w=222&bg=FFFFFF)
The approach of Halloween brings thoughts of jack-o-lanterns, scary movies, and buckets full of candy. The season also marks the time when investors finally give up the ghost on the optimistic, even wishful, earnings forecasts made early in the year.
Adding EM On A Rent-To-Own Basis

The Major Trend Index has remained in neutral territory during the last several weeks of upside action, suggesting there remain significant fundamental and technical shortcomings beneath it all. But this precarious MTI stance didn’t preclude us from acting on a new bullish reading for Emerging Market equities at the end of April.
Beware The Breakout

The S&P 500 finally erased the losses from its nine-day swoon in January and February.
Too Many Clocks
Whatever one’s philosophical leaning, the practice of adjusting earnings has left investors with too many watches to consult. We look deeper into the topic of adjusted earnings to gauge the slippage between commonly-referenced earnings clocks.
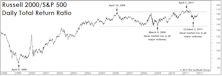
How The S&P 500 Could Hit 2,500… Ten Years Out
.jpg?fit=fillmax&w=222&bg=FFFFFF)
Yesterday was the six-month anniversary of the S&P 500 bull market high, and the index celebrated the event by nearly setting a new peak. Meanwhile, the S&P 500 Total Return Index did make a new high on Wednesday.
Missing Some Pocket Cash?

Given our money management mantra of “making it and keeping it,” we can’t imagine we’ll ever get comfortable with crypto-currencies.
How To (Almost) Double Your Money In Under Ten Years
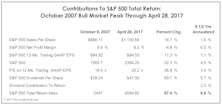
Buying the S&P 500 on one of the worst possible days in history ultimately yielded a total return of +87.4% (+6.8% annualized) through the end of April 2017...darn, sounds like an advert for Vanguard!
Which EPS Are We Talking About?

The distinction between reported GAAP earnings and adjusted operating earnings has long been a source of debate among fundamental investors, and the choice of “E” will materially impact each investor’s view of the market’s P/E ratio.
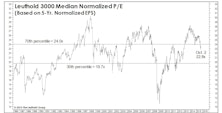
“Trailing” EPS Revisited

The S&P 500 trailing P/E has just climbed above 25x—lower than in March 2009—but incredibly high for any period in which earnings weren’t tainted by recession.
Four Thousand Companies Can’t Be Wrong!

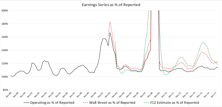
Scott Opsal’s “Chart of the Week” in mid-October suggested the seven-quarter S&P 500 earnings recession may have run its course.
EPS Touching Bottom?

Early in the third quarter earnings season, S&P 500 companies are providing a glimmer of hope that the long earnings recession may be ending.
No Sector On Sale...

While cap-weighted U.S. indexes remain far below their 2000 valuation highs, in some ways today’s market presents an even more difficult hurdle for value managers.
Xenophobia Gone Too Far?

Donald Trump’s all-but-certain Republican nomination is somehow a fitting capstone to a stock market era in which it’s paid to be provincial.
Valuations: The Bad And The Good
Foreign valuations experienced nowhere near the expansion enjoyed by U.S. stocks during the latest bull market, but their cheaper valuations rarely seem to inoculate them from outsized losses during corrections and bear markets.
A Kind Word For “Forward Earnings”
Our criticism of the widespread trust in “forward earnings” has sometimes been harsh, but consider the following: the latest 12-month forward EPS estimate for the EAFE index is $122.71, virtually matching the forward estimate that was made in January 2006.
Earnings: Less Than Meets The Eye

Amid all the praise heaped on the corporate sector for posting record earnings in the midst of a sluggish global expansion, allow us a respectful vote of dissent. Earnings are abysmal—especially among the S&P 500 companies presumed to be the torch-carriers for this cycle’s profitability rebound.
Market Valuation Check
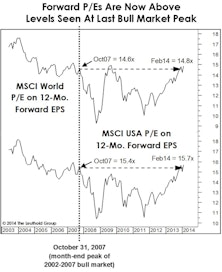
Stocks have long looked expensive on the basis of dividend yield, but now they look increasingly stretched on Forward EPS.
Sector Weightings Adjust To Reflect January Loss Leaders
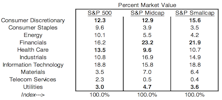
Consumer Discretionary sector weightings sank among all three market tiers, as this segment led the market lower in January. Health Care and Utilities sector weightings increased, as both outperformed for the month.
Dissecting The Capital Tier Indices

Sector weight changes during November were minimal.
Earning Momentum
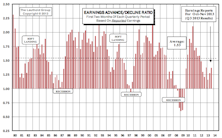
While the current ratio of 1.37 is relatively weak historically, it is still an improvement from the second months’ readings of Q2 (1.27) and Q1 (1.16).
Finding Value In “Forward Earnings”

Forward earnings might be the greatest Wall Street innovation in history: a tool that makes the stock market look cheap all the time.
S&P 500: Equal Weighted Outperforms In Q3; Maintains Lead YTD
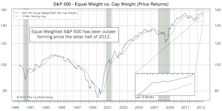
On a YTD basis, the spread between these two indices continues to expand, with the Equal Weighted index now outperforming by more than 4%. Consumer Staples is the most expensive sector among Large and Mid Caps, while Health Care is most expensive in Small Caps.
Earnings Momentum - Q2 Reports Below Average But Ahead Of Q1

With all three months of Q2 earnings reports in, the 1.28 ratio is much stronger than Q1, but remains below the 1.51 historical average ratio.
Global Valuations Rising, But U.S. Still At A Premium
The large valuation discount on foreign shares has narrowed a bit, reflecting better relative action in foreign shares over the past 14 months and relatively weaker foreign fundamentals.
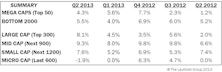
Q2 Median Company Earnings Growth Rates Vary Drastically Across Cap Size
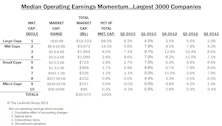
EPS growth for Large and Mid Cap companies continues exceeding their top-line growth, but Small and Micro Cap companies saw their EPS growth rates coming in below their top-line growth rates.
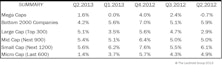
Q2 Median Revenue Comparisons: Higher Growth Across All Segments
Large Cap result this month is the same as last month, but remains stronger than Q1. Smaller firms reversed course, as Mid, Small, and Micro Caps all rebounded with large sales momentum increases.
Dissecting The Capital Tier Indices

Consumer Discretionary’s weight increased the most in the S&P 500, rising 0.5%. Health Care rose the most in Mid Caps (+0.3%), while Information Technology rose the most in Small Caps (+0.7%).
Key Observations On Q2 S&P 1500 Earnings
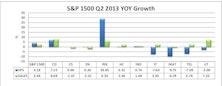
Year-over-year EPS growth rate for companies with Q2 reports (with about 65% in) currently stands at +4.2%, while revenue growth has come in at a better than expected +2.6%.
Q2 Median Company Earnings: Growth Rates Volatile But Positive In General
EPS growth rates are coming in higher than expected. While sales growth remains muted, the ability of companies to do more with less and maintain high operating margins is impressive. Margins are determined at the discretion of management and are thus sticky and unlikely to drop off significantly unless wage pressures resume and slack capacity around the globe is absorbed.
Q2 Median Revenue Comparisons: Higher Growth In Large And Mid Caps
Q2 relative to Q1 growth rates have improved for larger cap companies but deteriorated for the smaller firms.
Predictions for 2012…
From the stock market to politics to football, Doug Ramsey offers up ten predictions and thoughts for the New Year…. Even though we’ve already had a one month “peek” at 2012.
Perception for the Professional
September 2025 Issue

Featured Articles
Sector Navigator
September 2025 Issue
