High Beta
Seasonal Nightmare Ending?

We’ve reminded dejected readers throughout 2022 that this year was statistically “cursed” from the onset. It’s a year ending in “2” and a Shmita year on the Jewish calendar, both of which have been associated with far below average stock market returns. More importantly, it’s a midterm election year, traditionally the weakest of the four-year cycle.
High-Beta Bounce
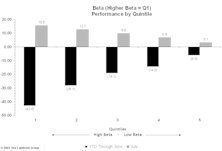
High-beta stocks outdid everything else during July, after getting crushed during the first half of 2022. At the end of June, Momentum was more correlated with low beta than any other time in our history.
Price to Book: Obsolete, Or Just Misunderstood?
.jpg?fit=fillmax&w=222&bg=FFFFFF)
The Value style has broadly underperformed for more than ten years, and the blame for this dismal decade has often been placed squarely on the Price to Book metric. Could it be that Price to Book’s sullied reputation is undeserved?
The Chart Everyone Missed
.jpg?fit=fillmax&w=222&bg=FFFFFF)
When we first met Steve Leuthold in the old company office in a renovated warehouse, he was updating a several-foot-long chart of either the DJIA or S&P 500, by hand, and we got a brief lecture on the importance of using logarithmic scale on price charts.
If You Think This Market’s Fishy, You’re Right

Tomorrow is the Minnesota season-opener for muskies, but the fanatics who chase them are likely disappointed that it comes a few days after an event that’s known to trigger these beasts: the full moon. The screenshot is from our $9.95 “iSolunar” iPhone app, and shows that Saturday merits only a “three fish” day (out of a possible “four fish”)—based on the moon’s fading illumination.
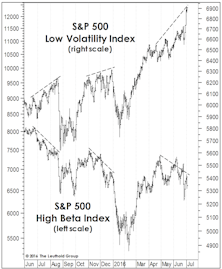
High Beta Breakout?
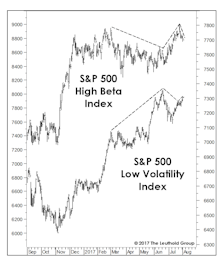
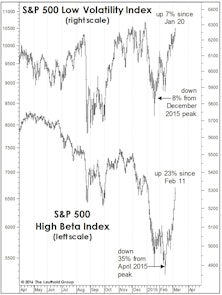
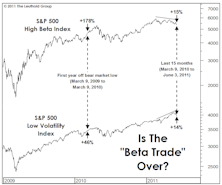
Last month we spent a full page explaining why the underperformance of the S&P 500 High Beta Index was not a bearish portent for stocks (Chart 1).
What Does The Low Vol Divergence Mean?
Low Volatility stocks have been the darlings of this bull market, and Low Vol is now considered a long-term “alpha generator” alongside such Hall of Fame quant factors as Low P/E and Price Momentum.
Tilt Toward Beta
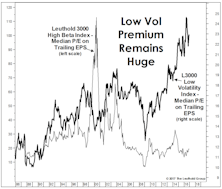
Stock market valuations certainly show no lack of investor confidence: each of our “Big Six” valuation measures now resides in either its ninth or tenth historical decile.
The “Low Vol” Unwind: Just The Beginning?
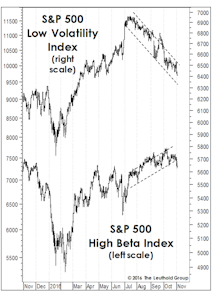
In mid-summer we suggested that attaining new market highs would probably require a rotation away from the long-time Low Volatility market leaders and into High Beta areas like Technology and industrial cyclicals.
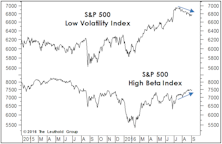
Beta Rotation Underway
For months we’ve speculated that any major extension of the bull market would require a rotation into High Beta groups from the Low Volatility and economically-defensive themes that were the market’s big winners from mid-2015 to mid-2016.
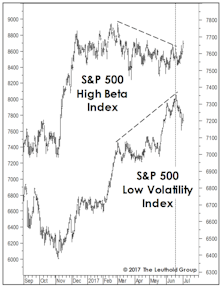
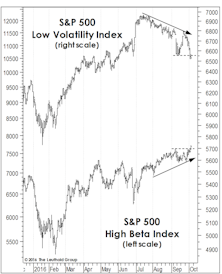
Rotation Away From Low Vol?
An encouraging break from a 15-month leadership pattern: Low Vol stocks have rolled over since mid-July, while the High Beta cohort has finally eclipsed its late-April highs.
Not Entirely In Sync
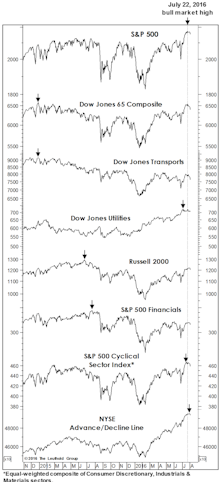
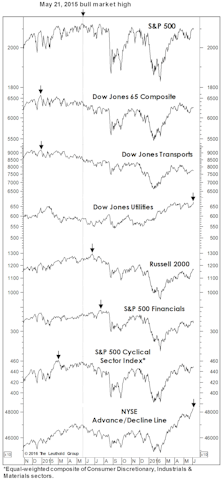
Despite the market’s strong rebound from February lows, four of the seven “Red Flag Indicator” components have failed to confirm the July new-cycle S&P 500 highs.
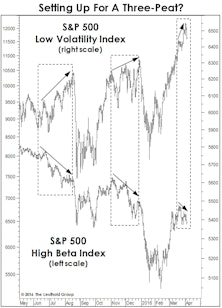
Low Vol Divergence, Episode 3
The divergence between S&P 500 Low Volatility and High Beta Indexes has emerged for the 3rd time in a year. The 3-month performance spread is even more extreme than it had been on the eve of either the August or December stock market air pockets.
Stock Market Observations
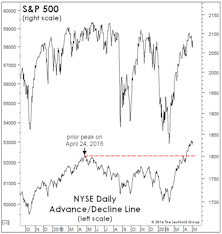
Commentators now label this cyclical advance the “seven-year bull market,” but that won’t be semantically true until the S&P 500 closes above its May 2015 peak of 2130.82.
Sizing Up The Rally
While our MTI became bullish in mid-April, we can’t rule out that the rebound from February lows could be an impressive bear market rally. However, this rally sports impressive technical credentials.
Stock Market Observations
The stock market rally off the February 11th lows has been powerful enough to lift the Major Trend Index into its Neutral zone (in fact, a high-neutral ratio of 1.04), and therefore certainly deserves some level of respect.
Beta Back In Vogue?
High Beta has certainly lived up to its billing, during both the multi-month decline and the three-week rally off the February 11th correction low.
Does The “Beta Breakdown” Matter?
Significant pull-back in High Beta stocks, but the weakening bid does not necessarily spell the end of the bull market.
Our Work With Beta Adjusted Relative Strength Pays Dividends
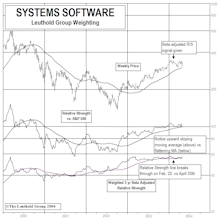
Over the last few years, we have been employing a beta adjusted relative strength calculation for high beta groups, along with the traditional relative strength. There are often more revealing signals given by the beta adjusted relative strength, especially in recent years.
Worth Noting

May supply/demand, seasonal investing and a study of Beta.
Perception for the Professional
April 2026 Issue

Featured Articles
Sector Navigator
April 2026 Issue
