ISM
ISM: Down, But Not Out
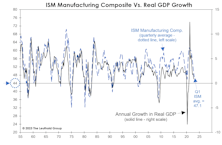
Early evidence shows the recent banking calamity knocked down already-fragile measures of confidence and activity, as exhibited by the ISM Manufacturing Composite posting a fifth-consecutive reading below 50.
Speed Trap Ahead?
In San Francisco, thefts of less than $950 have been decriminalized, while in Minneapolis, police are so beleaguered that car thefts not involving injury are ignored. Is it any wonder that the economy felt free to violate its usual stock market “speed limits” throughout much of 2021?
ISM Shows This Is A Different Kind Of Cycle
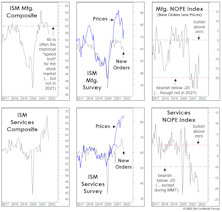
The manufacturing economy has thrown us a deflationary curve in 2019: The Price Index broke down in advance of New Orders, a reversal of the textbook recession/recovery sequence between these two measures.
Service Sector Slowdown?
While service industries have minimal direct exposure to trade disputes, they will begin to suffer from knock-on effects if the tensions continue to escalate.
Is The Trade War Short-Term Bullish?
We believe the U.S. free-trade initiatives of the last 25 years have been wildly bullish for the stock market.
A New ISM “Composite”
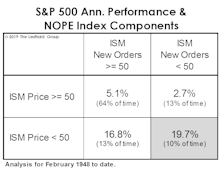
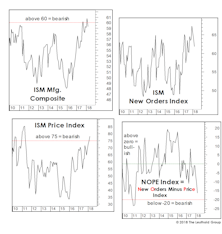
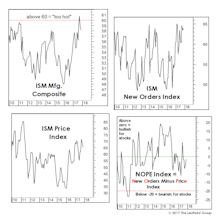
Over the past year, we’ve highlighted three mechanical market models based solely on components of the ISM monthly manufacturing report (Charts 1-3).
Inflation Warning Flags?
After yet another benign figure on wages for June, the idea that inflationary pressures might be a problem for the stock market seems far-fetched.
Feeble Recovery For The Feds?
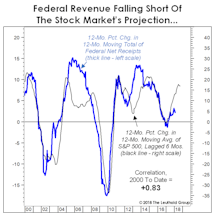
In light of the remittances they are about to drop in the mail, many readers will find it incredible that the U.S. Treasury has largely sat out the last two years of the stock market and economic upswing.
A Fleeting Glimpse Of Goldilocks?
The first several years of this recovery badly underperformed forecasts, with partial blame going to a pair of deflationary shocks (the European debt crisis and oil price collapse).
1987 Parallels (Part 3)
Today’s parallels to stock, bond, and forex market action of 1987 might not be so worrisome if that’s all there was to the story.
Market Pressure Points?
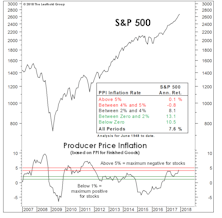
Last month we detailed a handful of economic and monetary measures that were approaching critical thresholds from a stock market perspective.
Pressure Points?
The first few trading days of the new year have been a seamless extension of 2017—a low-volatility, “measured” market melt-up.
The Chart The Fed Forgot
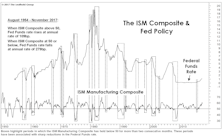
The Fed has long claimed itself to be “data dependent” while providing less and less information on those data points it considers most relevant. We can’t know what’s on that list, but we certainly know what isn’t: the ISM Manufacturing Composite, which (prior to the current cycle) provided an excellent gauge of the Fed’s policy bias.
The ISM: Good News Is Still Good News
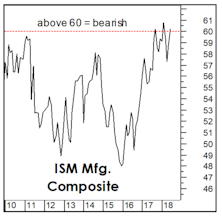
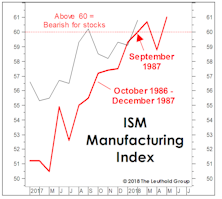
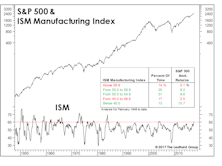
November’s report might have been lifted verbatim from the Goldilocks playbook, with the reading very strong but below the 60 level that we’ve statistically shown to be a threshold where “good news becomes bad news” for the stock market.
Too Much Of A Good Thing?
Swings in the stock market and economic momentum are not always synchronized, and the largest price adjustments in either direction tend to occur when they are not.
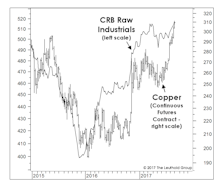
Commodities: How Strong Is Too Strong?
While the bond market doesn’t believe it, the past couple of months leave no doubt that the U.S. industrial economy has recovered from the energy-related slump of 2015-2016.
Inflation-No Impact On Policy Decisions
Inflation is slightly stronger than expected but has no impact on policy decisions. Right now, both the market and the data are telling the Fed to put the rate hike on hold. If the Fed decides to pass in September, there is a very good chance that the Fed might not be able to hike at all this year.
Muddle-Through Still Has The Benefit Of The Doubt
The market’s latest infatuation with bonds was driven by grave concerns that the weakness in energy and manufacturing sectors might be spreading to the U.S. economy as a whole.
The Bullish Case: A Mental Exercise
We’ve been correctly positioned near our tactical portfolios’ equity minimums, yet we’re oddly compelled to use this month’s “Of Special Interest” section as a very public second-guessing of that move.
Economic Green Light?
In our quantitative efforts, we typically find it more productive to use the financial markets to forecast the economy rather than the other way around. But there are exceptions...
Polar Vortex Hits The Markets Too
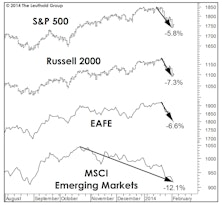
The stock market kicked off 2014 with a (so far) shallow bout of weakness which we don’t consider to be the start of a new cyclical bear market or even a deep correction.
Stocks And The Dismal Science
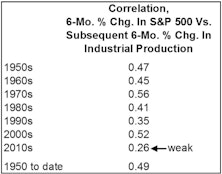
Has recent Fed experimentation compromised the stock market’s “social function” as an economic forecasting tool?
The Economy And Earnings
The YTD surge of 19% in the S&P 500 should ensure a stronger second half economy, and the big five-point jump in the latest Purchasing Managers Survey (ISM) might be the first evidence of this.
An Economic Buy Signal
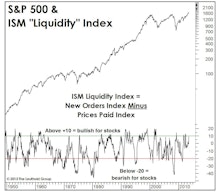
Does a simple twist on the ISM Index produce an excellent stock market indicator?
The Late Cycle Economy?
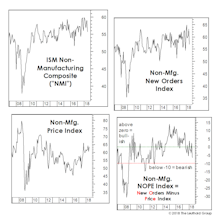
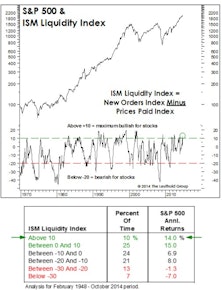
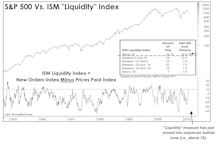
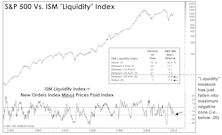
With the new ISM figures for March, the Liquidity Index has moved into the maximum negative zone with a reading just below the bearish –20 threshold.
A “Late-Cycle” Economy?
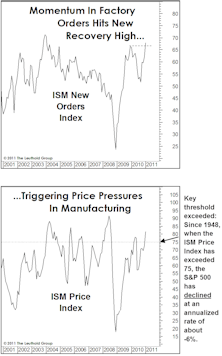
Economic growth is re-accelerating, but that growth is coming at a cost…price pressures are building significantly. Manufacturing prices are up along with commodity prices.
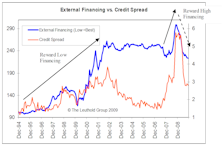
How Investors Are Rewarding Management Decisions: A Global Perspective
There are four key decisions a company’s management has to make: Dividend Policy, External Financing, Capital Expenditure (Capex), and Research & Development (R&D). We studied how the market rewards each of these management decisions.
