Leverage
How Much Leverage Is Too Much?
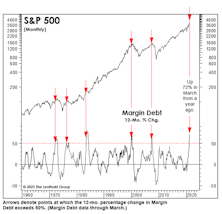
FINRA’s latest report shows a 72% annual gain in margin debt. Yet, in relation to the gain in stock prices, growth in Margin Debt is still well below the peaks of early 2000 and mid-2007—suggesting investors could take on considerably more leverage in the months ahead.
Sizing Up The Profit Recovery
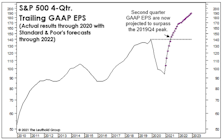
We don’t make much use of “Forward” EPS for the S&P 500 because analyst forecasts have tended to be hopelessly optimistic. But if their short-term projections are on target, when numbers for the current quarter are reported, 12-month trailing GAAP EPS will exceed the $139.47 pre-COVID peak.
Putting More And More On Margin

In one year, the bull market has persuaded investors to do something they were reluctant to do near the end of an almost eleven-year bull: Lever Up. Year-over-year growth in Margin Debt reached 49% in February and should catapult far above the “conventional” 50% danger threshold with March’s results.
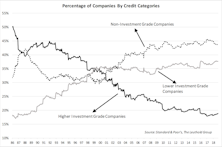
Corporate Debt Continues To Pile Up
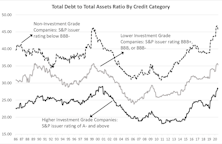
Public companies are loading up on debt. Since we wrote about this topic over a year ago, a few metrics have reached, or are surpassing, peaks of 1999-2000. When the readings move to extreme levels, we recommend readers take precautions.
Bank Loan CEFs: Double Leverage Implies Higher Risk
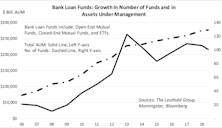
In prior publications we’ve written about corporate leverage, which has risen to an alarming level, and we’re concerned that this could be a trigger for the next market downturn.
Small Cap Biotech Getting Pricey Again
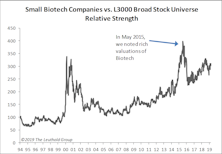
In May 2015, we warned about rich valuations for small cap Biotech stocks and looked at various ways to evaluate those companies, as the majority have no approved drugs on the market, thus no revenue; therefore, valuing these companies using the conventional methodology is problematic.
Corporate Executives Might Be Peeking Into Quants’ Toolkits
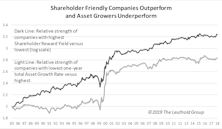
In terms of long-term planning, corporate executives are often tasked with choosing between expanding their business or returning cash as a way to reward shareholders. In the quant world, the two decisions have a consequence on future stock returns.
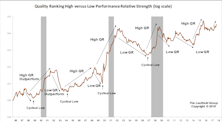
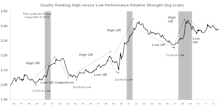
Time To Hide In Quality?
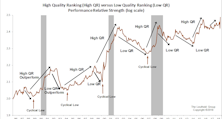
Although both High Quality and Low Quality stocks suffered in the last two months’ market turmoil, we are not surprised to see that, on a relative basis, High Quality stocks outperformed Low Quality.
Think Halloween Is Behind Us? Beware, Zombie Alert!
“Zombie” companies are being kept alive by low interest rates and generous credit conditions, and the number of them, worldwide, has risen significantly over the past few years.
Company Leverage And The Impact Of Rising Interest Rates

Higher corporate leverage and rising short-term interest rates have not yet led to problems in the credit markets, but investors should be mindful of potential risks.
Leverage Factor: A Boost For High Quality Stocks?
A review of Quality factors, as well as the lower valuations of High Quality stocks, supports the current High Quality cycle amid rising market volatility. The Leverage factor may provide particularly strong backing for High Quality stocks.
Leverage Factor: A Tailwind For High Quality Stocks?
Following 2016 underperformance, High Quality stocks eked out an advantage over Low Quality stocks to begin 2017 (+5.3% versus +2.1%, respectively). Yet, the “Junk Rally” trend seems difficult to reverse.
Divergence Among Quality Factors
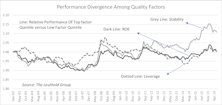
Performance and valuation of the three Quality factors are diverging. From a valuation standpoint, we might see a reversal in performance, with the Stability factor weakening and the Leverage factor strengthening.
Small Cap Leverage—A Concern?

With the Fed mulling over a rate increase, investors may have already started to avoid companies with excess leverage. Unfortunately, Small Caps, on average, are in this camp.
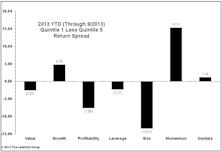
Factor Rotation Continues

While Momentum continued to struggle and Value surged, the Size factor played a much larger role as Small Caps were hit hard in April.
Trading Volume Nothing To Worry About
We take a detailed look at the decline in trading volume and conclude the trend might be a positive going forward.
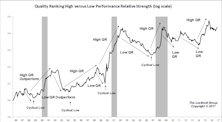
Leuthold Stock Quality Rankings
Our Stock Quality Rankings currently show that stocks with Low Quality rankings outperformed those with High Quality rankings.
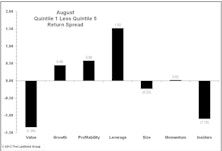
Market Dynamics: 2012 Sector Performance; Leverage Pays

In our framework, Health Care is the number one performer year-to-date by almost five percentage points.
March Performance: Factors Continue To Lack Consistency… Except For Momentum

Momentum once again has the best performance. This out-of-favor factor has continued to outperform the rest of the factors.
View From the North Country

Recent “hedge” fund trauma marks the end of hedge fund mania. The risk in quantitative models: Never bet the entire farm on any statistical model when the unpredictability of the human factor is involved.
View From the North Country

The downside of leverage...lesson better off learned early in one's career, rather than later. Expanding our emerging Asia Pacific coverage to include ADRs. Observations from a Russian visit.
View From the North Country

Is sophisticated the same as smart? Market neutral operations are supposed to involve little or no market risk, so how could the entire asset base go down the drain?
Perception for the Professional
March 2026 Issue

Featured Articles
Sector Navigator
March 2026 Issue
