Market Cap
Has The Stock Market “Eased?”
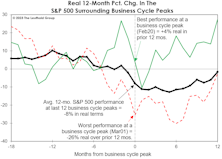
The path of real stock prices in the current cycle looks very different from the typical pre-recessionary track. In fact, based only on the chart of performance in real terms since January 2022, we’d probably believe the economy has recently emerged from recession.
Big Time
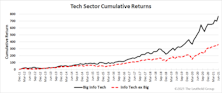
Market environments are driven not just by industry preferences, but also by a bias toward the very largest companies. We have developed a new set of groups composed of the 10 largest companies from each sector. With several of these baskets sporting positive rankings, we felt a closer look was in order.
Be Wary Of The “E” In P/E
.jpg?fit=fillmax&w=222&bg=FFFFFF)
U.S. equity valuations remain considerably higher than those of any major foreign market, but there’s no denying they’ve improved from the cyclical peak made in January 2018. That’s true across the capitalization spectrum, and on the basis of both normalized and non-normalized fundamentals.
Beatlemania And Narrow Markets

In April 1964, the Beatles simultaneously held the top-five spots on the Billboard Hot 100, a unique feat in the history of modern music.
Can Companies Sustain Cash Payouts?
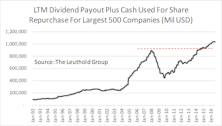
Companies are returning cash to investors at a level never before seen. Counting dividend payouts and outstanding share repurchases, the amount of cash returned back to investors crossed the $1 trillion mark for the first time in January 2016 (based on trailing twelve-months’ total for the largest 500 companies, Chart 1).
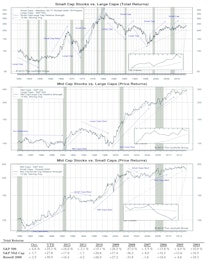
Small/Mid/Large Caps

Small Cap Premium Drops to 8%
Small Cap/Mid Cap/Large Cap

Small Cap Premium Sinks To 13%
Dissecting The Capital Tier Indices

Sector weight changes during November were minimal.
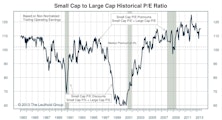
Small Cap Premium Ticks Up To 16%
Small Caps are selling at a 16% valuation premium relative to Large Caps, using non-normalized trailing operating earnings. Using estimated operating earnings, Small Caps are selling at a higher valuation premium of 23% (25% last month).
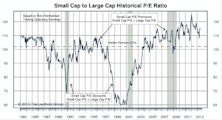
Small Cap Premium Remains 15%
Small Caps are selling at a 15% valuation premium relative to Large Caps, using non-normalized trailing operating earnings. This is the same as the past two months’ readings. Using estimated 2013 operating earnings, Small Caps are selling at a higher valuation premium of 23% (24% last month).
Dissecting The Capital Tier Indices

Consumer Discretionary’s weight increased the most in the S&P 500, rising 0.5%. Health Care rose the most in Mid Caps (+0.3%), while Information Technology rose the most in Small Caps (+0.7%).
Small Cap Premium Remains 15%
Small Caps are selling at a 15% valuation premium relative to Large Caps, using non-normalized trailing operating earnings. This is the same as last month’s reading. Using estimated 2013 operating earnings, Small Caps are selling at a higher valuation premium of 24% (25% last month).
The Disappearing "Large" Effect And Emerging Market Performance
While U.S. stocks have surged this year, Emerging Markets have languished. What is going on in Emerging Markets to cause this unusual situation?
April Factor Performance: Talk About Boring

Very little to show for a month of solid market performance. Breaking the market down by capitalization yields some interesting results.
Dow Performance: A Matter Of Weighting...
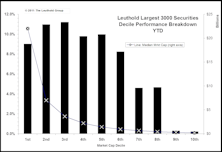
Are the Dow Industrials benefiting from trivial weighting? Slicing our Leuthold 3000 universe into market cap deciles shows different performance results than commonly followed market indices.
Leuthold Stock Quality Rankings—Tracking Quality And Risk Cycles

While Low Quality stocks have been beating High Quality, performance was on par in Q1. High Quality cheap relative to Low Quality and the tide may be turning.
Cash Is King… The Regime Of Buying Power Is Alive And Well

One might begin to think that if the reports of money supply growth rolling over are true, that the stock market could be facing its own liquidity crisis in short order. While these reports sound pretty bleak for future stock market liquidity, we advise taking these headline “scare” stories with a grain of salt.
Technology: Applying Positive Thinking To Our 9th-Rated Sector

Is it time to buy Technology? This month's “Of Special Interest” examines the sector's merits and finds that while there are signs of improvement, it is too soon to make a big move here.
A Closer Look At 2007 Projected Earnings Growth

Initial results for Q1 earnings look disturbing. Analyst estimates of 2007 year end earnings for stocks have been declining across all market cap tiers, with biggest declines in the Energy sector.
Modifications To Leuthold Growth Versus Value Methodology

We have modified our Small Cap and Mid Cap Growth versus Value methodology, improving the algorithm for distinguishing between growth and value to make the components more reflective of these sectors.
Breadth Is Lagging…..But It Can Lag For a Long Time Before The Market Rolls Over
Market breadth improving, but still relatively weak. Narrowing breadth can, however, persist for a long time. There was a two year period of diverging breadth in 1998 to 1999, prior to the last bear market.
Did You Have The Right Mix In 2005?

2005 Performance Recap: Equities, Fixed Income, Large Vs. Small Caps, Weighted Vs. Unweighted S&P 500, Industrial Metals and AdvantHedge.
S&P 500 Energy Weight Is Misleading: Fewer Constituents, Not Less Market Cap

S&P 500 Energy weight is misleading. Adding the largest multi-national integrated oil companies to the S&P’s 10% energy weight doubles it to 20%.
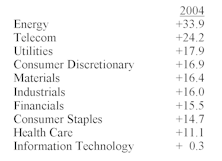
Analyzing Large Cap, Mid Cap & Small Cap 2004 Composite Income Statements

2004 earnings very strong but further earnings improvements in 2005 will be largely a function of stronger sales, not any more margin expansions.
Did You Have The Right Mix In 2004?
Small Cap Stocks were hands down winners relative to large caps, while just edging out mid caps. This is the fifth consecutive year of small cap superiority.
Turning The Corner

After a string of three consecutive down market years, the closing bell on the eve of the recent New Year put to bed the first annual gain for the U.S. stock market since 1999.
Equity Performance By Market Cap Tiers
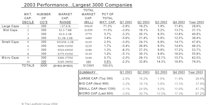
Weighted versus Unweighted S&P 500 comparison, Russell 2000 versus S&P 500 annual comparison and 2003 equity performance by market cap tiers.
Total U.S. Market Capitalization As A Percentage Of GDP: An Alternative Valuation Perspective
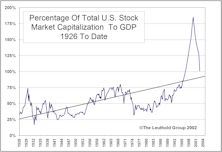
Total U.S. Market Capitalization As A Percentage Of GDP: Identifying “Fair Value.”
Capitalization Tier Meausres

Continuing to evaluate Leuthold Index methodology.
Capitalization Tier Meausres

Continuing to evaluate Leuthold Index methodology.
Capitalization Tier Meausres

Continuing to evaluate Leuthold Index methodology.
Capitalization Tier Meausres

Continuing to evaluate Leuthold Index methodology.
Capitalization Tier Meausres

Continuing to evaluate Leuthold Index methodology.
Capitalization Tier Meausres

Continuing to evaluate Leuthold Index methodology.
Capitalization Tier Meausres

Continuing to evaluate the Leuthold Index methodology.
Capitalization Tier Meausres

Continuing to evaluate the Leuthold Index methodology.
Tech Watch…..S&P Tech Subset Down 5% In July

Worse than expected Q2 earnings (losses) beat down the tech sector in July. The bad news just won’t end.
Capitalization Tier Meausres

Continuing to evaluate Leuthold Index methodology.
"Value" Performance Superiority May Soon End

Value may continue to outperform Growth for the balance of the year, but by a narrower margin.
Capitalization Tier Meausres

Continuing to evaluate Leuthold Index methodology.
Perception for the Professional
March 2026 Issue

Featured Articles
Sector Navigator
March 2026 Issue
