Market Lows
Valuations: What Bear Market?
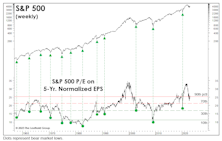
If the October S&P 500 low holds, the normalized P/E ratio of 22.7x on that date will signify the priciest bear market bottom in history; in fact, it is exactly the same level reached as at the August-1987 bull market high. Since October, the normalized P/E multiple has grown to 25.5x—higher than all but three previous bull market peaks.
More Extreme Than 1999?
We noted that the December 2018 stock market low was the second most expensive in history, second only to that of October 1998. Similarities between 2019 market action and the 1998-99 rebound remain eerie. Something isn’t right, and it’s not bullish.
Take A Closer Look At “Goldilocks”
We’ve frequently written of the uncanny parallels between the rallies of 2018-19 and 1998-99, but hope that newer readers don’t mistake this analysis as a forecast.
1998 Parallels
There are enough parallels between the 1998 and 2018 market declines that we decided to flesh out the comparison a bit more.
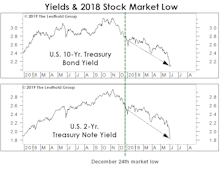
What Are Bonds Telling Us?
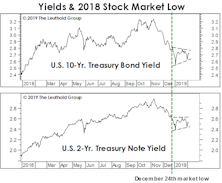
Corporate bonds aren’t the only asset reluctant to embrace the stock market’s latest “all clear” verdict on the 2019 economy.
Leuthold Quick Takes: Cyclical Bear Or Recovery Refresh?
The fourth quarter selloff and subsequent rebound, as seen by Doug Ramsey (Chief Investment Officer) and Jim Paulsen (Chief Investment Strategist).
Leuthold Quick Takes: Cyclical Bear Or Recovery Refresh?
The fourth quarter selloff and subsequent rebound, as seen by Doug Ramsey (Chief Investment Officer) and Jim Paulsen (Chief Investment Strategist).
Characteristics Of Major Market Lows
.jpg?fit=fillmax&w=222&bg=FFFFFF)
We wrote in the January Green Book that the S&P 500 Christmas Eve low did not have the “right look,” in that: (1) there had been no sign of “smart money” accumulation beforehand; and, (2) downside momentum was also at a new low for the entire correction. Smart money buying is measured by the Smart Money Flow Index, which evaluates trends in first half-hour market action (considered to be more emotional and news-driven), and the last hour of trading (viewed to be more informed and institutional in nature).
December’s Low Didn’t Have The “Right Look”

As the market sunk to a 3% loss on Christmas Eve, we sensed genuine investor panic—at least among the fraction of investors then paying attention.
How This ‘Borderline’ Bear Stacks Up
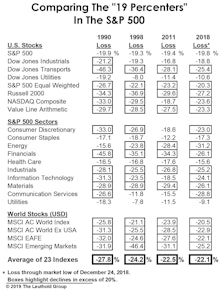
The S&P 500 has again shown its mysterious ability to defy the conventional bear market threshold, with the decline into its Christmas Eve low becoming the fourth one in the last 30 years to halt just shy of the magic -20% figure.
Perception for the Professional
June 2026 Issue

Featured Articles
Sector Navigator
June 2026 Issue
