Mid-Term Elections
Irrationality Is Back, Right On Schedule
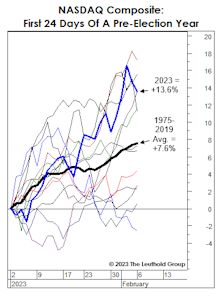
The hostile monetary backdrop makes recent stock market exuberance even more irrational than in early 2021. Yet, this is the middle of a seasonal window that historically boasts an elevated level of craziness: It is the year preceding a presidential election—a time when monetary and fiscal stimulus are ramped up.
Bonds: Not A Four-Letter Word
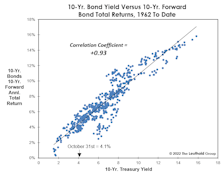
The bond market bubble has popped, and forward-looking Treasury returns are no longer a disaster. We aren’t suggesting one pile into them with yields near 4% and inflation around 8%, but we think they have suffered a much more substantial de-rating than large-cap stocks.
A 2022 Trifecta?
Our Major Trend Index has four factor categories, and three of them (Valuation, Cyclical, Technical) remain negative. Yes, the bearish “trifecta.” If that sounds like a reprint of one of our Monday MTI memos, bear with us (pun intended). We thought the MTI—with over 125 inputs—was pretty exhaustive. It turns out that it’s lacking entire categories pertinent to stock market action:
Seasonal Nightmare Ending?
We’ve reminded dejected readers throughout 2022 that this year was statistically “cursed” from the onset. It’s a year ending in “2” and a Shmita year on the Jewish calendar, both of which have been associated with far below average stock market returns. More importantly, it’s a midterm election year, traditionally the weakest of the four-year cycle.
Past Pivots Prompted By Politics
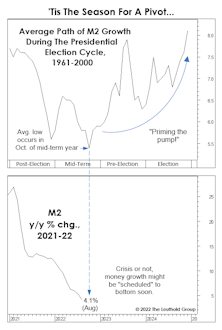
We scrutinized the typical path of money growth during the four-year presidential election cycle, and found that it typically tends to bottom out in October of the midterm year! The cycle says a monetary pivot is imminent, and the average pattern traced out by M2 suggests an acceleration in the growth rate of about 2.5% leading up to the presidential election.
Midterm Elections—Not A Typical Year
While midterm elections are not typically big market movers, there is really nothing typical about 2022.
A Year That Was Cursed From The Start
In January we put it bluntly: “Longer-term time cycles don’t line up for a prosperous 2022.” Not only is it a mid-term election year, but also a Shmita Year. Eight months later, the S&P 500 loss through August has exceeded 10% for only the twelfth time since 1926.
Time Cycles Got It Right; What Do They Say Now?
The enormity of the preceding mania and its vicious unwind have us believing the current bear could unfold over a much lengthier time than is typical. But a combo of time cycles suggests a major low is due any time.
Cycles: Is The Worst Yet To Come?
Does the market’s poor YTD performance prior to the six-month “Sell in May” combined with the Presidential Election Cycle help “inoculate” it against a typical mid-year, mid-term swoon? Yes, there’s some evidence to support that view—especially with Small Caps.
Cycles: A Key “Window” Is Approaching
Next month kicks off the seasonally-weak phase of the stock market’s Annual Cycle: May-October. Overlaid on that is the statistically vulnerable stretch of the four-year Election Cycle: the “mid-point” of the Mid-Term Year. There’s a positive way to spin this mid-term malaise: The cycles imply that an ideal window for a major low is about to open.
Have We Already Had The Year-End Rally?
In the March Green Book, we discussed the long history of stock market difficulties during mid-term election years. Incredibly, nine of the past 11 cyclical bear market lows have occurred in these years, with eight of those nine recorded during the seasonally-weak months of May through October (Table 1).
Seasonality Set To Favor The Bulls
Our bearish stance could be tested by the arrival of the seasonally strongest six-month window of the four-year electoral cycle. Since 1926, November of the mid-term year through April of the pre-election year has produced an average un-annualized S&P 500 +16.4% total return.
Mid-Term Elections—History Might Not Be A Good Guide
While mid-term elections are rarely big market movers, this year’s election demands more attention as it has the potential to alter the balance of political power in Washington.
Stock Market Defies Seasonal Gravity
“That which does not kill us, makes us stronger” might be a good motto for this never-ending bull market. The bull continues to shrug off the effects of both Quantitative Tightening and an escalating trade war, and it’s doing so during a seasonal stretch in which many of its predecessors have sunk to their knees (if not their demise).
Cycle Collision?
The coming months form a bearish cross-section of two of the most prominent calendar anomalies: “Sell In May,” and the Presidential Election Cycle (in which the mid-term year is statistically the weakest). Between the two, we’d have to rate the former as more powerful and statistically persistent.
Have Stocks Already Priced In “MAGA?”
Athletes aren’t the only ones known to sometimes suffer a “sophomore slump.” Presidents do, too… at least according to the historical verdict of the stock market...
Mid-Term Mayhem?
The prospect of a mid-term congressional shake-up may rattle the markets in 2018. Since 1962, nine major bear market lows occurred during mid-term election years, with eight of those happening during the traditionally weak months of May through October.
Mid-Term Election – Favorable For Stocks
General patterns are a weaker dollar, rising stocks and range-bound bond yields.


.jpg?fit=fillmax&w=222&bg=FFFFFF)

.jpg?fit=fillmax&w=222&bg=FFFFFF)

.jpg?fit=fillmax&w=222&bg=FFFFFF)


