Presidential Election Cycle
Fiscal “Juice?”
Not to pick a fight with Keynesians (or other economists), but we’re reluctant to label the explosion in the federal deficit as unequivocally “stimulative.” Some factors behind the increase probably do boost the economy, but others simply rob Peter to pay Paul.
The Pre-Election “Put”
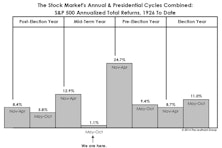
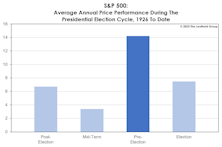
Years preceding presidential elections are more likely than others to feature stock-price action that is favorably disconnected from the fundamentals. Since 1926, the average S&P 500 gain in a pre-election year is +14.2%—about double the next-best year of the cycle.
Irrationality Is Back, Right On Schedule
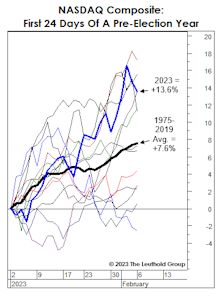
The hostile monetary backdrop makes recent stock market exuberance even more irrational than in early 2021. Yet, this is the middle of a seasonal window that historically boasts an elevated level of craziness: It is the year preceding a presidential election—a time when monetary and fiscal stimulus are ramped up.
2023 Time Cycles: Two Outta Three Ain’t Bad
2022 was a nasty year for the stock market, but a wonderful one for market numerologists. This year is a different story. Two of the three calendar patterns are bullish, including the one in which we put the most stock (pun intended): The Presidential Election Cycle.
Seasonal Nightmare Ending?
We’ve reminded dejected readers throughout 2022 that this year was statistically “cursed” from the onset. It’s a year ending in “2” and a Shmita year on the Jewish calendar, both of which have been associated with far below average stock market returns. More importantly, it’s a midterm election year, traditionally the weakest of the four-year cycle.
Past Pivots Prompted By Politics
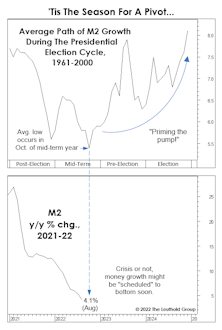
We scrutinized the typical path of money growth during the four-year presidential election cycle, and found that it typically tends to bottom out in October of the midterm year! The cycle says a monetary pivot is imminent, and the average pattern traced out by M2 suggests an acceleration in the growth rate of about 2.5% leading up to the presidential election.
A Year That Was Cursed From The Start
In January we put it bluntly: “Longer-term time cycles don’t line up for a prosperous 2022.” Not only is it a mid-term election year, but also a Shmita Year. Eight months later, the S&P 500 loss through August has exceeded 10% for only the twelfth time since 1926.
Cycles: Is The Worst Yet To Come?
Does the market’s poor YTD performance prior to the six-month “Sell in May” combined with the Presidential Election Cycle help “inoculate” it against a typical mid-year, mid-term swoon? Yes, there’s some evidence to support that view—especially with Small Caps.
Inaugurations And The Stock Market
Presidents and the popular press have become obsessed with performance over the “first 100 days” in office. That prompted us to see if there have been any persistent stock market effects related to this 100-day window. There are many ways to slice the data, and the more we sliced it, the fewer the observations.
The Stock Market Is Trading Like Trump’s A Democrat!
Around the time of Donald Trump’s inauguration in January 2017, we observed that prevailing valuations argued against him witnessing big stock market gains during his first term.
Cycle Collision?
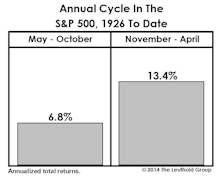
The coming months form a bearish cross-section of two of the most prominent calendar anomalies: “Sell In May,” and the Presidential Election Cycle (in which the mid-term year is statistically the weakest). Between the two, we’d have to rate the former as more powerful and statistically persistent.
Have Stocks Already Priced In “MAGA?”
Athletes aren’t the only ones known to sometimes suffer a “sophomore slump.” Presidents do, too… at least according to the historical verdict of the stock market...
Trump Inherits Poor ‘Initial Conditions’
We think that stocks in Trump’s current term will fall short of Obama’s gains, mostly reflecting a valuation starting point that’s almost twice as high as Obama’s was. “Managing expectations” doesn’t seem like Trump’s style, but in the case of the stock market it might not be a bad idea.
Apologizing in Advance for Trump
While Wall Street is extremely well represented in the new administration, we doubt that Wall Street’s performance under Trump will come close to that enjoyed under Obama.
Another Cycle Snafu
In regards to fixed time cycles, Richard Russell—who died last month at 91—used to complain, “Where are they when you need them?” We agree, and present 2015 as just the latest example.
2015: An “Anomaly?”
We’ve written periodically about the Presidential Election Cycle in relation to stock prices, sheepishly acknowledging both the persistence of the pre-election year effect and its pervasiveness across many markets
The Worst Of The “Window” Is Upon Us
Three months ago, our “Of Special Interest” section reviewed the historically pronounced effect of the well-known “Sell In May” phenomenon during mid-term years of the presidential election cycle.
Two Market Anomalies Intact: A Quantitative Review
We are entering the most bearish window among the potential combinations of the Presidential Election Cycle and the Annual Cycle.
A Quick Take On Time Cycles
We stop short of embracing any sort of fixed stock market time cycle, but it's statistically difficult to discredit certain calendar patterns.
Small Cap Stocks: Hard To Make The Numbers Work…
Leuthold’s Doug Ramsey takes an in depth look at historical Small and Large Cap cycles and offers insight as to where we stand now and what can be expected going forward.
Selling In May: A Market Maxim That Won’t Go Away!
This month’s “Of Special Interest” takes a stab at debunking the “Sell In May And Go Away” anomaly. Instead, we have come to respect this annual strategy.
Will The Fabled Election Cycle Work Again?
Doug Ramsey looks at his own 15 month election cycle work to examine historical performance for a variety of different asset classes.
Where Wall Street Meets Pennsylvania Avenue
Presidential election-year performance vs. non-Presidential election-year performance…. Searching for an intersection that doesn’t exist!
Pre- And Post-Election Stock Market Performance
An analysis comparing S&P 500 performance for the current election year to the performance averages of all election cycles since 1944.
Pre- And Post-Election Stock Market Performance
The average gain for the entire 12 month period spanning the pre- and post-election periods is not much different from the average gain in the comparable 12 month period for all years including non-election years.
Pre- And Post-Election Stock Market Performance
Over the past several months, we have been comparing S&P 500 performance for the current election year to the performance averages of all election cycles since 1944.
Pre- And Post-Election Stock Market Performance
Over the past several months, we have been comparing S&P 500 performance for the current election year to the performance averages of all election cycles since 1944.
The "Wait and See" Market
It now seems that the market has settled into a comfort zone— or put differently— a trading range that reflects investors’ current lack of conviction about prospects for the second half of the year.
Market Volatility And The Presidential Cycle...Surprisingly Lower
This month, at the request of a client, we examined stock market performance volatility in the periods leading up to past Presidential elections.
Market Mood Swings
Bull market still intact, but investor appetite for risk remains subdued. April’s preference was for defensive and conservative strategies. Old axiom “Sell in May and go away” doesn’t seem to apply during the 130 days leading up to election day.
View from the North Country
It seems that once all of Wall Street becomes aware of an indicator or historic market pattern, the damn things no longer seem to work. Is this now true of the Presidential election cycle? Well, don’t give up on this yet. According to Arthur Merrill’s research, the market so far in 1984 has been acting just like it is supposed to. The fireworks come in the last two quarters of the year.




.jpg?fit=fillmax&w=222&bg=FFFFFF)

.jpg?fit=fillmax&w=222&bg=FFFFFF)


