Profit Margins
Waking From A Slumber?
We’re very skeptical that the rally from last October’s low represents the first leg of new bull market. But if it is—as many believe—then it has unquestionably inherited the worst set of genes we’ve ever observed in the species.
Marg-flation
The 2022 bear market will be remembered as a year when collapsing growth stock valuations and rising interest rates doomed almost every asset class to return purgatory. Hopes for avoiding a second down year rest with a potential top in interest rates and solid earnings underpinning the stock market. Wall Street strategists have a year-end 2023 price target of just over 4,000 for the S&P 500, a few percentage points of upside from today but hardly reason to toast a prosperous new year.
Research Preview: Inflation And Margins
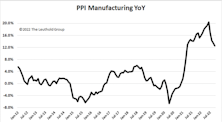
A new study looking at the relationship between inflation and profit margins is introduced. The goal is to understand how the latest margin peak was reached in mid-2021 and what impact inflation might have on margin forecasts underlying next year’s earnings estimates. Full report will be sent mid-month.
Earnings Expectations: The Bear’s Other Shoe
To paraphrase that great market historian Leo Tolstoy, “each bear market is unhappy in its own way.” Recession, interest rates, valuation bubbles, inflation, war, credit cycles, oil prices, manias & panics: the tipping point that triggers each bear market is always different. However, bearish forces ultimately manifest themselves in just two ways; declining earnings and/or declining valuations. June’s Of Special Interest report detailed how the current bear market has been fueled entirely by collapsing valuations, with the largest P/E compressions occurring in companies with the highest starting valuations.
Margin Pressure Under The Surface?
The spectacular economic rebound from the pandemic lockdown lifted corporate earnings to heights that are almost hard to fathom. That stupendous earnings run has been fueled by rising profit margins, which also reached record highs after the pandemic.
Research Preview: The Impact Of Falling Estimates
The 2022 bear market has been driven entirely by a collapse in P/E ratios. Last month, we noted that the other potential driver of market declines—falling earnings—had yet to raise its ugly head. Now we examine past episodes to consider how the stock market might react when the “other shoe” (EPS) drops.
Peak EPS: Another Critique
It’s only been a few years since we added the Peak P/E ratio to our suite of market valuation measures. That situates us in the uncomfortable position of having to explain why a big decline in this newer metric might be misleading.
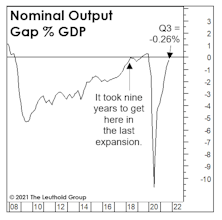
“Gapping” Lower?
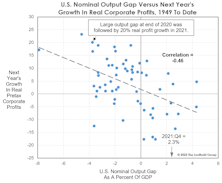
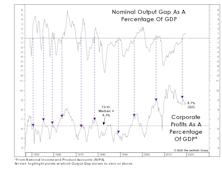
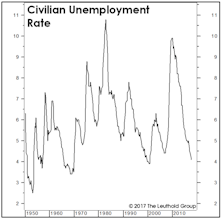
NIPA’s “all-economy” profit margin declined a bit in Q4—which typically peaks before SPX profits—and that falloff coincided with the economy officially reaching full employment, based on the CBO’s Nominal GDP Output Gap. When the Output Gap has flipped positive (like in Q4), corporate profit margins usually come under immediate pressure.
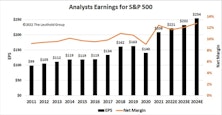
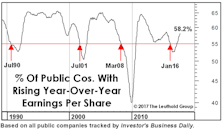
Earnings: Reversing The “New Normal?”
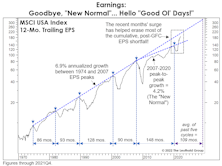
If earnings’ nearly vertical ascent continues for another six months, 12-month trailing EPS will intersect the 6.9% long-term-growth trend line connecting the five major EPS peaks between 1974 and 2007. The “New Normal” has given way to the “Good Ol’ Days!”
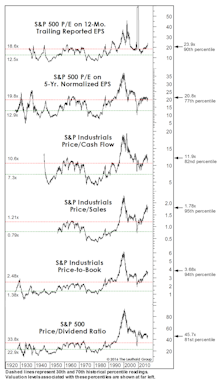
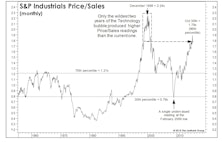
Bubble Or Not? Two Valuation Takes
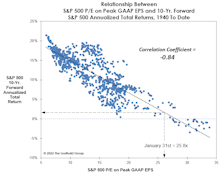
In early 2018, we thought the market was expensive, but certainly not a bubble. Today, the trouble is not just high P/E multiples, but the sustainability of the “E” itself—with profit margins nearly 20% higher than ever before. Whether one believes U.S. Large Caps are engulfed in a bubble or not, we have a P/E ratio for you.
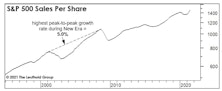
New-Era Profits, New-Era P/E Multiples
The current mania won’t last forever. But our use of the “New Era” label in describing the last-quarter century or so of stock-market dynamics is still useful—in part because it highlights fundamental developments that simply cannot be repeated indefinitely.
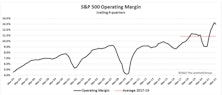
Full Employment Brings Margin Risks
How high can corporate profit margins go? The third quarter saw a new record of 11.0% in NIPA “all economy” after-tax margins, and figures for the S&P 500, due out in a few weeks, will also set a record.
A Marginal Measure Of Margins?
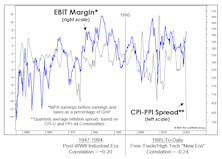
For those believers in a new economic- and stock-market era, there’s good news. The CPI-PPI spread has not been an effective proxy for profit margins during the 1995-to-date “New Era.” But, the failure of an inflation measure during a mostly non-inflationary era shouldn’t come as a surprise.
“Into The Weeds” With Normalized EPS
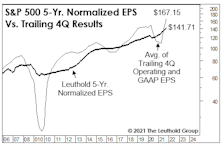
The environment where massively above-trend federal outlays have generated massively above-trend readings in both current and projected S&P 500 EPS, the idea of normalizing EPS over a period as long as five years might seem hopelessly out of touch. But it’s during times of extraordinary conditions—both good and bad—that render this work especially valuable.
Long-Term Returns: You Wanted The Best, You Got The Best!
In a possible sign we’re not getting enough oxygen at current valuation altitudes, we decided to replace the usual mean-reversion technique with a much friendlier approach that we’ve dubbed “maximum attraction.”
Superhuman Feats Got Us Here
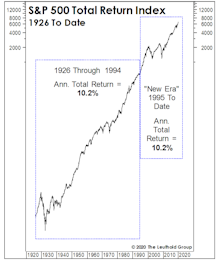
The simultaneous “New Era” ascension in margins and P/E ratios hasn’t generated anything exceptional from a return perspective. To the contrary, annualized S&P 500 total returns over this 25-year period of margin magic and (mostly) escalating P/E ratios merely match “Old Era” returns.
What’s Embedded In The Consensus?
.jpg?fit=fillmax&w=222&bg=FFFFFF)
Market momentum now seems to outweigh simple math in the minds of most investors, and we are not entirely immune. Today our tactical funds are positioned with net equity exposure of 50%, the midpoint of the normal 30-70% range. That’s a higher allocation than if we considered only business cycle dynamics and equity valuations.
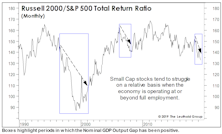
Small Cap Quality Check
December’s Of Special Interest provided a recap of our Asset Allocation team’s view of small cap equities, suggesting that small caps had underperformed and reached a valuation discount that made them an interesting contrarian value proposition. Several clients responded with follow-up questions, wondering if the discount valuation of small caps was offset by their typically weaker business models.
Are Earnings Set To “Gap” Higher?
We are troubled that the bullish optimism has spilled over into the 2020 estimates for S&P 500 earnings. Zero growth in 2020 is probably not a bad guess for NIPA figures, but S&P numbers don’t always follow suit.
It’s Not What They Borrowed, But How They Used It
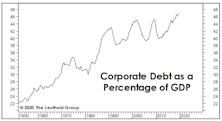
Following the deflationary bust of 2007-2009, the last decade was expected to be one of deleveraging. Only U.S. consumers appeared to get that memo, however.
A Spectacularly Average Thirty Years
In the spirit of good holiday cheer, we made a partial concession to the True Believers with a December “Chart of the Week” in which we narrowed our stock market valuation analysis to the historically elevated levels of last 30 years.
Allocation Implications Of Full Employment
While the economy’s move above its full-employment level carries reliably negative implications for profit margins, the impact on equity returns has varied greatly from cycle to cycle.
An Economy This Healthy Is Hostile To Profits
.jpg?fit=fillmax&w=222&bg=FFFFFF)
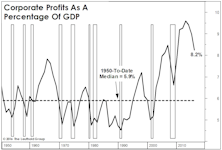
It’s hard to grow profits when an economy’s resources are already fully employed, a fact we highlighted when the U.S. Output Gap turned positive several quarters ago. Therefore, the first quarter drop in NIPA corporate profits, reported yesterday, shouldn’t have come as a surprise.
Margins Prove Capitalism Still Works
.jpg?fit=fillmax&w=222&bg=FFFFFF)
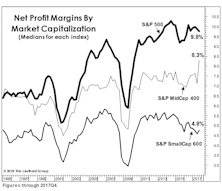
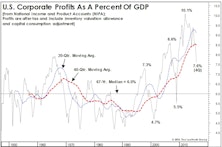
Corporate profits were outstanding last year, but even the benefit of a 40% cut in the top income-tax rate wasn’t enough to lift the net profit margin back to the all-time high of 10.6% established in early 2012. Still, the latest 10.0% figure is more than a percentage point above the 2007 cycle high and about two points better than any other cycle high.
They Can’t Tax What’s Not Earned

With three quarters of a sharply lower corporate tax rate on the books, the median four-quarter trailing profit margin for both the S&P 500 and S&P MidCap 400 jumped to all-time records in the third quarter.
What Can Margins Do For An Encore?
.jpg?fit=fillmax&w=222&bg=FFFFFF)
A massive drop in corporate tax payments lifted the third quarter NIPA profit margin back to the 10% level for the first time four years. But while we try not to always view the glass as half empty, we find it troubling that margins remain well-below their 2012 highs (10.6%) in spite of this one-time windfall.
The Gap Is Back!
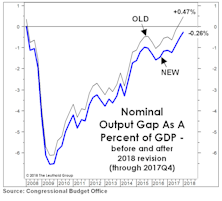
We celebrated the official closure of the GDP Output Gap in December, but that milestone was revised away in April by the statisticians at the CBO through a downward adjustment to the estimated rate of “full employment.”
Musings On Margins
Fourth quarter earnings were the last ones to be burdened by a 35% top marginal corporate income tax rate, and therefore seem to have been given a pass by the analyst community.
Multiple Contraction—Just A Little Patience?
Things were bigger when you were a kid. Like that enormous sweatshirt your aunt gave you for your birthday or that hand-me-down ten-speed bike with the cross bar taller than your shoulders.
The “Gap” Is Gone. Now What?
In Q3, the CBO’s Nominal Output Gap swung to positive for the first time since the last business cycle peak. This type of move has historically meant the cyclical peak in profit margins is close at hand.
Sector Margin Checkup
U.S. companies hoping for a reduction in the corporate tax rate are not exactly doing a convincing job of demonstrating “need.”
Recent Years’ Oil Price Experience Akin To 1980s’
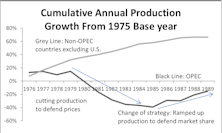
We revisit commentary we published in 2015 regarding the late-2014 oil price crash and review why, at that time, we believed oil prices could stay at depressed levels for a longer period than most expected. Additionally, we advise avoiding two Energy sector segments: companies with high balance-sheet risk, and Energy Royalty Trusts.
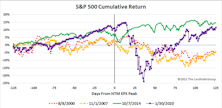
How To (Almost) Double Your Money In Under Ten Years
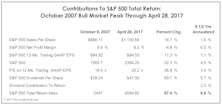
Buying the S&P 500 on one of the worst possible days in history ultimately yielded a total return of +87.4% (+6.8% annualized) through the end of April 2017...darn, sounds like an advert for Vanguard!
Sector Profit Margins: A Long-Term Review
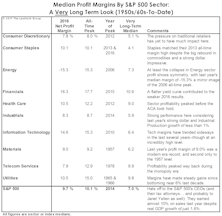
Despite real GDP growth of just 1.6% in 2016, the median S&P 500 company earned a net profit margin of 9.7%, only 40 basis points below the record high established in 2014.
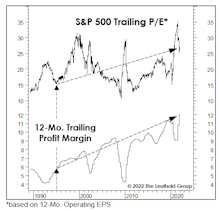
“Trailing” EPS Revisited

The S&P 500 trailing P/E has just climbed above 25x—lower than in March 2009—but incredibly high for any period in which earnings weren’t tainted by recession.
Valuations: The Correction That Never Was
The correction failed to meaningfully “reset” any long-term valuation measures, hence, we don’t view the current environment as having much investment merit, but rather, primarily speculative appeal.
Profit Margins At The Sector Level
S&P 500 profit margins mask the disparate trends taking place on a sectoral level. We dissect those trends with the ten major sectors grouped by five broad themes: Cyclicals, Commodities, Defensives, Interest Sensitives, and Tech/Telecom.
Margins: Mean-Reversion Works
A late March issue of The Economist proclaimed “profits are too high” and “America needs a giant dose of competition.” Funny. NIPA Corporate Profits figures released that week show The Economist’s plea for lower profits had already been fulfilled—and not just in the latest quarter.
Implications Of Low Growth, Low Inflation, Low Rates
The current environment will likely persist longer than most expect which will put further downward pressure on profit margins. As margins come under pressure, companies increase leverage to prop up ROE. However, the market wants higher duration, not higher leverage.
To Play The Rally, Or Not To Play?
Question: What will you do if the Major Trend Index returns to its bullish zone?
Perception for the Professional
March 2026 Issue

Featured Articles
Sector Navigator
March 2026 Issue
