Russell 2000
Small Caps: Unresponsive
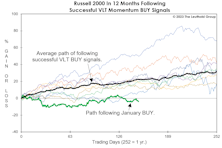
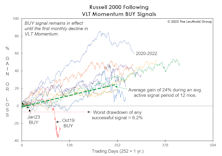
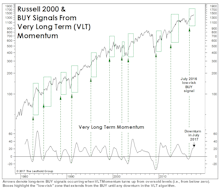
Based on successful Russell 2000 VLT BUY signals, 1982-forward, the index had gained an average of 23% eight months later—and none had a losing position. Since the VLT BUY on January 31st (eight months ago), the Russell 2000 has dropped 3.9%. Furthermore, Small Caps bottomed 15 months ago, and in a normal cyclical bull market, the Russell 2000 would be up 50-70% by this time.
Lowering The Bar!
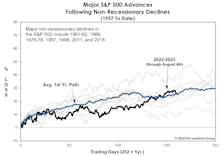
As we’ve noted, none of the major indexes has kept pace with the typical path traced out during past cyclical upswings. It has since occurred to us that this nearly ten-month stock rally is being compared to an unrealistically high standard: The current advance doesn’t have the advantages enjoyed by bulls that launched out of recessionary conditions.
A Look At Where Rate Hikes Are “Working”

Speculative spirits are back, and the index that’s suddenly close to its 2021 high is the one we viewed as the epicenter of the mania—the NY FANG+® Index!
Small Caps Missed The Memo

For the first time since 1946-47, the super-bullish, six-month window beginning with the mid-term elections through the following April, failed to see a material upswing in Small Caps.
Small Caps Getting Cheaper By The Day
It was September 2020 when we suggested that a new multi-year phase of Small-Cap-stock leadership had begun. Almost immediately, the Russell 2000 reversed a big chunk of the prior decade’s underperformance. Unfortunately, that was the extent of the run.
VLT: You Read It Here Last
We anticipated it for months, and now that it has finally happened, we’re burying the news in the final page of this section. Yes, the last day of March saw the S&P 500 trigger a “low-risk” BUY signal on our Very Long Term (VLT) Momentum algorithm, known elsewhere as the Coppock Curve.
The Cycle That Never Was
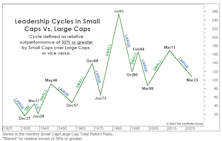
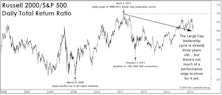
At 144 months, this is now the longest Large-Cap cycle on record, but its dominance will have to prolong to eclipse the second-longest leadership phase (1946-1957), in which Large Caps achieved a 190% performance spread above Small Caps.
Small Caps: We’ve Seen This Setup B-Four
In mid-2020, we wrote that a new multi-year leadership cycle had probably begun. Technically, that belief hasn’t been disproven, but the extent of outperformance has been disappointing in the nearly three years since.
Small Cap Malaise
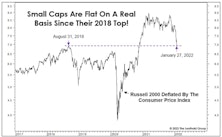
Imagine telling a Small Cap investor in mid-2018 that: (1) the U.S. economy would spend all but two months of the next 4-1/2 years in expansionary mode; and (2) M2 money supply would increase by 50% in that time, and yet the Russell 2000 would gain a grand total of just 9% over the same span.
VLT Update
The progression of bullish technical evidence since October’s S&P 500 low is compelling, though not overwhelming. With that low now almost four months behind us, the VLT Momentum oscillator for the S&P 500 probably “should” have already triggered a new BUY signal. Yet, both the S&P 500 and NASDAQ Composite are still holding out.
Supercharging VLT With Small Caps

Leuthold did not invent VLT. The credit goes to Sedge Coppock, a technical analyst who insisted on being called an “econometrician.” While the famed Coppock Curve was based on the Dow Jones Industrial Average, Leuthold found the algorithm useful at the industry group level—it is a component within our Group Selection (GS) Scoring system.
X-Rays And EKGs
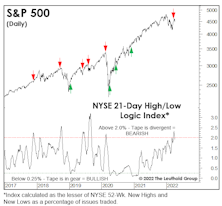
In late March, the S&P 500 rallied to within 3.5% of its January high, likely prompting producers at CNBC to put in an order for “S&P 500 5,000” hats. But we think that 4,000 will be undercut before 5,000 is topped, and action in key indexes (with the notable exception of the S&P 500 itself) reinforces our view.
Two Ways To Spin The Russell 2000 “Bear Market”
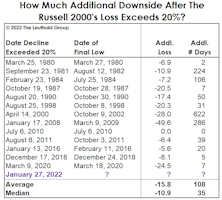
At the market’s January 27th close, the headline blared, “Russell 2000 Enters Bear Market.” Well, not exactly. If one accepts that a 20% decline constitutes a bear market, then the bear actually began on November 9, 2021—the day after the Russell 2000 peak.
“Collared” By The Fed?
In late January, the S&P 500 was down so much (almost 10%!) that it revived talk of investors’ favorite “safe” security. No, not T-bills—and not even Amazon or Apple common stock—but the Fed “put.” Years ago, we called it the “hypothetical” Fed put. But by now, we’re believers.
Small Caps’ Three-Year Ride To Nowhere
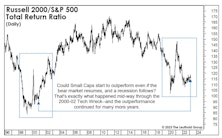
Yesterday, the Russell 2000 closed down 20.9% from its November 8th high, and market bulls have conceded it was “due” for a pullback after a 146% gain off the March-2020 COVID lows.
The Russell’s decline is moderate by the historical high-beta standards of Small Caps. However, this drop—combined with other developments transpiring over the last few years—has produced a shocking result: The Russell 2000 is now unchanged on an inflation-adjusted basis since its “Quantitative-Tightening Top” of August 31, 2018. But what a three-year ride it’s been!
Speculating In “The Nebs”
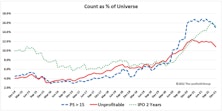
One measure of a bubbly bull market is the degree of speculative fervor embedded in the prices of companies with nebulous, indeterminate, or even nonexistent intrinsic values. Since the bear market low in March 2020, speculative manias have evolved in a menagerie of asset classes including Innovators & Disruptors, SPACs, meme stocks, crypto currencies, and NFTs. Based on the breadth of valuation extremes across numerous and diverse assets, this bull market may rank second to none.
A Squandered Small-Cap Opportunity?

We know our view on this is controversial, but we like the relative prospects for Small Caps—even though we still believe the broad stock market is currently the most speculative one in U.S. history.
A Look At The Small-Cap Setback
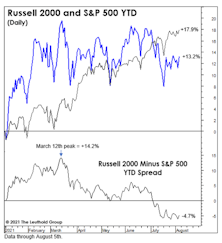
The Russell 2000 has blown the 14% lead it had built against the S&P 500 earlier this year, and now trails the index by almost 5%. Has that type of intra-year reversal happened before, and, if so, did it portend a major change in leadership?
Where Are The Leaders We Need?
Small Caps lagged during the bounce off the March lows before a late-April spurt briefly pulled them ahead of the S&P 500. Still, considering that Russell 2000 losses were so much steeper than the S&P 500’s (-43% versus -33%), we would have expected something better.
Small Cap Smack-Down

We were fooled on Small Caps, and it’s been a “multi-factor” catastrophe.
A Small Cap Strategy Session
Leuthold’s research team has recently flagged a number of items that suggest it may be time to consider small cap stocks. This asset class has been showing signs of life and the decision to overweight small caps is starting to seem relevant – and perhaps nicely profitable - again.
VLT Complicates The Market Puzzle

At October’s close, a long-term BUY signal was triggered on the Russell 2000. The fact that some market segments are triggering “oversold BUYS” when blue chips are at record highs speaks volumes about the internal disparities that have developed during the last few years. The Russell BUY signal is not inconsistent with our belief that the action since the January 2018 peak remains part of a lengthy cyclical topping process.
The Market Puzzle Gets Even More Complicated

At last night’s close, the Russell 2000 generated a “low-risk” BUY signal on our Very Long Term (VLT) Momentum algorithm, a possibility we’d alluded to in the September and October Green Books.
Small Cap VLT BUY: Not Quite...

Small Caps came tantalizingly close to activating a major VLT BUY signal in September, with the Russell 2000 closing less than a half percent below the trigger level. A new bull signal from this indicator wouldn’t “fit” into our market and economic narrative, but we won’t sweep it under the rug if it occurs.
Box Jumpers Beware!
.jpg?fit=fillmax&w=222&bg=FFFFFF)
Style rotation! Regime change! Market action of the first two weeks of September coaxed the few remaining Small Cap Value managers off ledges from New York to San Francisco.
Small Caps: “What If?”

The Russell 2000 is the most important major index on the cusp of a new BUY signal. Our best guess is that Small Caps will still trend lower for now, creating a buying opportunity in the months ahead.
Big Is Still Beautiful
The 10-year-old bull grabs most of the headlines, but its younger sibling has begun to command more respect.
Partying Like It’s 1998-99
.jpg?fit=fillmax&w=222&bg=FFFFFF)
We thought Jerome Powell’s “Christmas Capitulation” would be tough to beat, but he accomplished that two days ago with what could be called his “Spring Surrender.” That, in turn, has rekindled hopes of a stock market melt-up along the lines of 1998-99, which, as old-timers will remember, followed a late-cycle correction that was nearly identical to the one seen last year.
Multiple Personality Disorder?

Market behavior is always nebulous enough to generate diverging opinions, but lately it’s been sufficiently strange to give rise to a diverging set of facts.
If You Think This Market’s Fishy, You’re Right
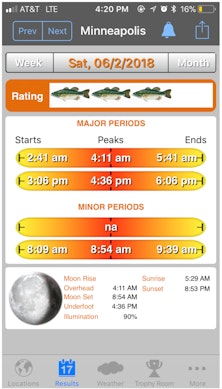
Tomorrow is the Minnesota season-opener for muskies, but the fanatics who chase them are likely disappointed that it comes a few days after an event that’s known to trigger these beasts: the full moon. The screenshot is from our $9.95 “iSolunar” iPhone app, and shows that Saturday merits only a “three fish” day (out of a possible “four fish”)—based on the moon’s fading illumination.
Is Small Cap Leadership Bullish?
.jpg?fit=fillmax&w=222&bg=FFFFFF)
The Russell 2000 closed above its January 26th high on Wednesday, and well beforehand bulls had seized upon the secondary stocks’ leadership as evidence that all is right again with both the U.S. economy and stock market...
Mid-Term Mayhem?

The prospect of a mid-term congressional shake-up may rattle the markets in 2018. Since 1962, nine major bear market lows occurred during mid-term election years, with eight of those happening during the traditionally weak months of May through October.
Stock Market Observations
We remain bullish on stocks but with very limited visibility into 2018.
VLT Goes “Quiet”
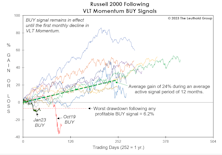
Last year’s “low-risk” BUY signals from our Very Long Term (VLT) Momentum algorithm have proven very profitable, but enough time has elapsed that they should no longer be considered an important bullish factor.
What’s Ailing Small Caps?

While the Russell 2000 loss during the 2015-16 correction was almost double that of the S&P 500, the decline did not fully erase the P/E premium Small Caps have enjoyed since the middle of last decade. The premium might need to be entirely erased before a multi-year Small Cap leadership cycle can begin.
More Upside For Small Caps?

There was a major cyclical BUY signal (VLT Momentum) for the S&P 500 in late-May, and as of July’s close, that bullish development was reinforced by a new VLT BUY signal on the Russell 2000.
A Milestone You Might Have Missed
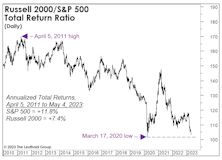
The fifth anniversary of the bull market was met with fanfare, but the launch of the Large Cap leadership cycle in April 2011 is receiving no attention whatsoever.
Stock Market Leadership In 2014: Large Caps, Tech, Health Care
Following a great year for trend-following, capitalizing on key reversals in sector performance will be important in winning the 2014 performance derby.
How Long Can Small Caps Lead?
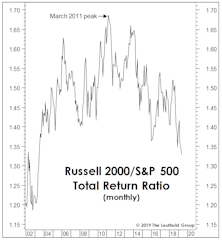
The Russell 2000 is about five points ahead of Large Caps YTD, and is approaching its April 2011 long-term relative peak. We view this outperformance as their leadership’s last gasp and not a new cycle.
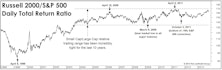
Large Cap Vs. Small Cap: Performance Parity 1979 To Date

If we look only at the past eleven years, 2000-2010, the S&P 500 has decisively underperformed the Russell 2000.
Perception for the Professional
March 2026 Issue

Featured Articles
Sector Navigator
March 2026 Issue
