Sentiment
Neutral (But Leaning Negative)
U.S. stocks have either begun one of the most underwhelming and economically illogical bull markets in history, or have staged an exceptionally long and deceptive bear market rally. Our bet is on the latter.
Irrational Optimism?
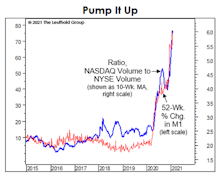
During bear markets, speculative psychology can remain depressed long enough to have a self-fulfilling impact on the economy. In today’s experience, we expect investors’ economic fears will be “fulfilled” in coming months. In the short term, however, at least one measure of optimism has sprinted out ahead of the stock market itself.
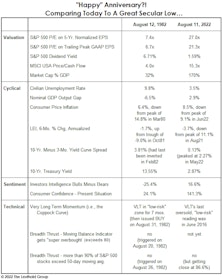
Are You Better Off Than You Were Forty Years Ago?
Old timers will recognize our title as a twist on Ronald Reagan’s clincher in the final 1980 presidential debate with Jimmy Carter.
We recalled Reagan’s line while preparing for today’s 40th anniversary of the great 1982 secular stock-market low. Investors in the S&P 500 have earned an annualized total return of +12.4% since that trough, about two percentage points above the long-term average.
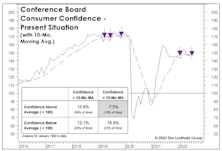
Confidence Cracking?
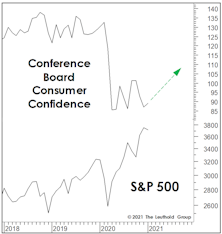
The theory of “contrary opinion” is important to market analysis, but so is an understanding of its limitations. When investor-sentiment surveys dipped sharply in late January, we warned that the declines (which are usually signals to “buy”) might instead mark the beginning of an important trend change.
Sentimental Musings
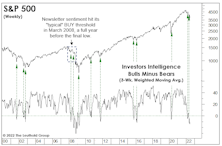
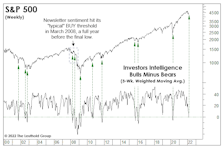
Most sentiment measures show none of the frothiness that lingered in the months after the Y2K Tech bust. Rather, some exhibit actions reminiscent of early 2008.
Watching The “Smart Money”
Of the prevailing bullish arguments, the one that strikes us as the weakest is that there’s “too much pessimism.” Much like in 2000, some pundits disingenuously made that claim before the market rolled over. But at this point, with the market now down big and economic numbers suddenly wobbly, the last thing any bull should want is too much pessimism.
Sentiment: Why The Long Faces?
Those who want validation to buy aggressively with the market down 10% can reference two historically reliable, intermediate-term sentiment measures with fresh BUY signals—and there’s a third one that’s also very close to triggering a BUY. The problem is that boundaries defining extreme psychology change over time—with a key inflection occurring as the market transitions from bull to bear.
How Much Leverage Is Too Much?
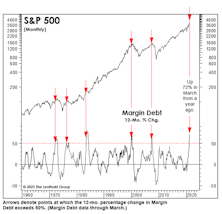
FINRA’s latest report shows a 72% annual gain in margin debt. Yet, in relation to the gain in stock prices, growth in Margin Debt is still well below the peaks of early 2000 and mid-2007—suggesting investors could take on considerably more leverage in the months ahead.
Stock Market Observations
The speculative peak for this market rally may have occurred in either January (when GameStop and other “left for dead” short candidates soared), or February (when indexes tracking the “newborns”—IPOs and SPACs—both peaked). But even if we knew that for certain, a major peak in stock prices could still be months away.
Earnings Are Back In Focus
Earnings releases (ER) are normally accompanied by large stock-price movements, either to the upside or downside.
Here, we computed the percentage of companies that registered a large move in their stock price on their ER day in the trailing three-month window (500 basis points up OR down). In order to normalize for non ER-day volatility, we computed the percentage of all companies that registered a significant price move on any day during the same period. The difference between the two is shown in Chart 1.
Our Most Contrarian Industry Group Ideas
Contrarian investing is difficult from both an emotional and implementation standpoint. Often the consensus is right, and industry groups are out-of-favor for a reason. As the saying goes, “Don’t be contrarian just for the sake of being a contrarian.”
A Flight Of Wee Dragons
In our mid-month Of Special Interest, “Valuation Extremes: Here Be Dragons,” we examined valuation outliers as a measure of market sentiment. The hypothesis was that exuberance is reflected in investors’ willingness to hold stocks priced on an aggressive “vision” of the future; companies that are either habitually unprofitable or trade at a Price/Sales ratio above 15x.
Climbing The Wall Of Confidence?
Stock market valuations may be considered the ultimate in fundamental measures, but they can just as easily be considered long-wave sentiment indicators. What causes equity investors to pay as little as 10x for S&P 500 Normalized Earnings at one point (March 2009), but pay more than 30x a dozen years later? The Fed printing press was in overdrive at both points; only emotions can account for the difference.
Silly Season
Move over, Y2K! In late January, the squeeze of popular hedge fund “shorts” eclipsed anything we saw at the peak of the Technology bubble. But who knows? An even wilder event might be in store in coming months.
Passive’s “Placid Pandemic Performance”
The 200-day “report card” for this bull market shows the best initial-performance gain of all postwar bulls, but it’s come at a price. Investor sentiment is above levels seen at the same point of past bull markets… and there are the valuations.
Wall Of Worry?!?
Many pundits argue that sky-high valuations on stay-at-home stocks “prove” equity investors somehow remain fearful. It’s a nuanced, short-term argument, and there’s merit to it: We’d argue such fears have produced terrific relative values among “SMID” Cap stocks.
Sentimental Musings
We get irked when TV pundits misrepresent the mood of equity investors as unduly pessimistic based one or two (or zero) data points. Among the dozens of “Attitudinal” indicators we track, an overwhelming majority show professional and retail investors have jumped back into the fray.
Sentimental Musings
Long-term sentiment indicators have carved out a four-month pattern similar to what we’ve observed in Large Cap valuation measures. That’s no surprise; valuation is a sentiment measure.
Sentiment Has Been Crushed, But Might Need To Just Languish For A While
We didn’t see the coronavirus coming and, like millions or perhaps billions of others, underestimated its likely economic impact when it began to spread. But stock market risks were high well before the virus hit.
Here’s One Reason Sentiment Is So Subdued...
Market bulls remain mystified by the lack of enthusiasm for stocks given the proximity of U.S. indexes to all-time highs. They view this relative indifference as a contrarian positive—the “wall of worry” argument.
Odds & Ends
Here are some brief follow-up notes on topics covered in recent months’ Green Books.
Are You Really A Contrarian?
The need to sound contrarian has become a borderline obsession among market pundits. Media opportunities for talking heads have exploded in the last decade, forcing those who hold the safest consensus views to falsely portray themselves as lonely and misunderstood market mavericks.
Leuthold Quick Takes: Getting Sentimental
This issue of Leuthold Quick Takes reviews the conflicted nature of investor sentiment as seen by Doug Ramsey (Chief Investment Officer) and Jim Paulsen (Chief Investment Strategist).
Building The Wall?
One of the more impressive feats that bullish pundits have pulled off is their successful portrayal of themselves as lonely and misunderstand contrarians even as the eleventh year of a cyclical bull market grinds on.
1999 Redux
As the market rebound has extended, we’ve noted its striking similarities with the rally of 1999—one that might have been the most speculative in U.S. history.
You Call That A Panic?
Christmas Eve came not with snowfall but a market freefall which was the worst-ever recorded for that date.
Market Observations
It’s been one of the worst years on record for diversification, with our hypothetical All Asset No Authority (AANA) portfolio down 7.2% YTD through yesterday. That’s the second-worst year for AANA since 1972, and there’s probably not enough time left for performance to undercut 2008 (-24.9%) for the bottom spot.
Time To Get Contrary With Commodities?
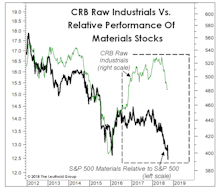
After a strong 2016 and a “Bridesmaid” (i.e., sector runner-up) performance in 2017, the Materials sector seemed primed to benefit from the “late cycle” character of the economy in 2018.
Investor Temperament And The “Tape”
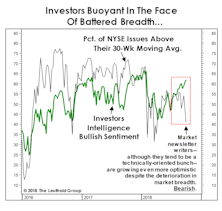
In the first week of October, the share of newsletter bulls topped 61% just as the NYSE percentage slid to 41%. Maybe it’s a seasonal thing… the last time that happened was October 2007.
A Troublesome Commodity Pattern...
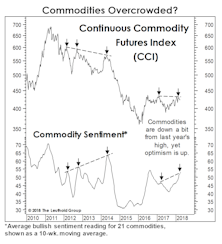
During each of the last five months, the U.S. economy has shown a broadening array of “late-cycle” characteristics.
“What, Me Worry?”
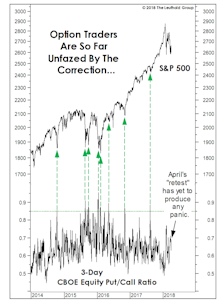
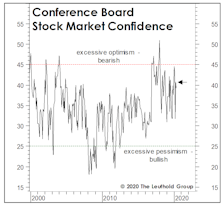
Our shortest-term put/call measure has yet to reflect the level of fear usually triggered by a correction of this size. Meanwhile, the market setback has done almost nothing to stymy the optimism of either market newsletter writers or mutual fund timers.
A Long-Term Take On Sentiment
We impatiently published this study two months ago instead of properly waiting for full-year numbers.
A Long-Term Take On Sentiment
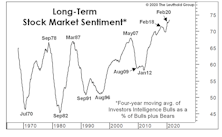
Tax cuts, a strong economy, and daily stock market records have lifted measures of investor sentiment to levels not seen in two decades. But sentiment is only a slightly better timing tool than valuations (which is not saying much), and there’s plenty of room for excitement to build before a final top is at hand.
Not A Tipping Point, But A “Toggle” Point?
Evidently, being a bull in a bull market is no longer good enough.
A Longer-Term Take On Sentiment
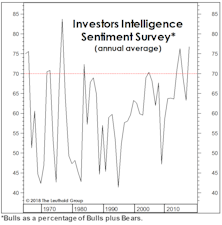
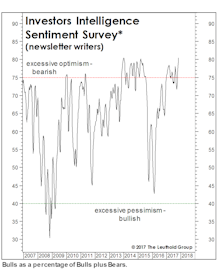
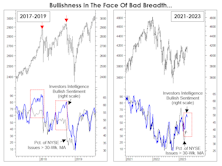
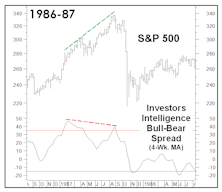
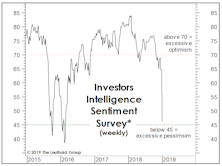
Stock market bears had a field day when the latest Investors Intelligence sentiment survey (Chart 1) saw the percentage of bullish newsletter writers spike to its “highest level since 1987.”
Thoughts On Sentiment
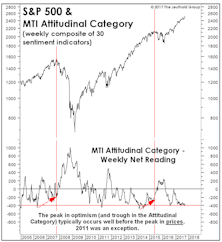
The MTI’s Attitudinal category has held stable over the last several months, an impressive (and contrarily bullish) feat considering the steady onslaught of new bull market highs.
A “Good Year” To Start The Year
The S&P 500 was up 6.4% YTD through March 3rd, a bit above its average annualized gain of 5.9% since 1926. In other words, 2017 would be a good year if the books were closed today.
Stock Market Observations
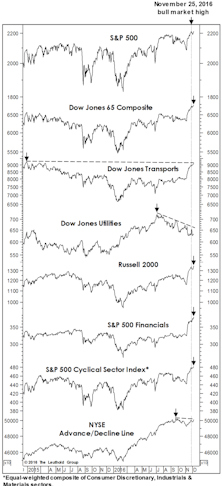
We revisit our “Red Flag Indicator” of prior bull market tops versus today. Usually most of these internal market measures will deteriorate in advance of the final bull market peak. At the latest S&P high, three of the seven leading measures had raised Red Flags, by not confirming, but two of them (DJ Transports and the NYSE A/D Line), are within just ticks of new bull market highs.
Bond Bubble Spills Into Equities
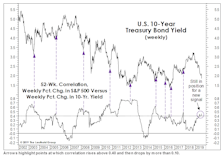
The S&P 500 once again remains on the verge of a new bull market high, thanks in large part to the bubble in another asset class: Bonds.
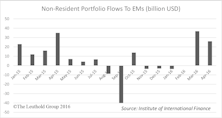
EM: Improved Sentiment But Macro Risks Still Dominate
Positive forces may be transient. Be wary of EM’s high correlation to commodities and Chinese stocks.
.jpg?fit=fillmax&w=222&bg=FFFFFF)

.jpg?fit=fillmax&w=222&bg=FFFFFF)

.jpg?fit=fillmax&w=222&bg=FFFFFF)
.jpg?fit=fillmax&w=222&bg=FFFFFF)
.jpg?fit=fillmax&w=222&bg=FFFFFF)
