Supply Demand
Cash Left The Sidelines Long Ago

The “cash on the sidelines” is a Supply/Demand argument that we’ve struggled with even in the most bullish of times; every purchase of a security is matched with a sale. But even taking the argument at face value, current holdings of retail investors and mutual fund managers suggest that the cash left the sidelines long ago.
Net Cash Outflows Recorded Across Nearly All Broad Fund Categories

Negative cash flows were the trend across major fund subsets in the latest week; bond ETFs were the only category to buck the trend.
2013 Fund Flow Trends Hold In 2014—Equities Still The Preference

Newfound fund flow trends established midway through 2013 are still unbroken halfway into 2014. Even with net cash inflows resuming to bond mutual funds, the definitive shift in preference for equity funds, although more subtle, is still intact.
Domestic Equity Mutual Funds and Bond ETFs See Weekly Net Outflows.

Within two broad categories – domestic equity funds and bond funds - mutual funds versus ETFs continue to display opposite flow trends.
YTD Bond Mutual Fund Flows Top 2013 Comparator

Bond mutual funds continue to capture net inflows while their ETF counterparts have seen net outflows for three straight weeks. Domestic equity mutual funds see more net outflows, but (barely) hang on to positive YTD flows.
Bond ETF Net Outflows Accelerate

Bond ETFs, Domestic Equity Mutual Funds and Money Market Funds see weekly net outflows, while all other broad categories experience net inflows.
2013’s Preference Shift To Equity Funds Holds In 2014

Many fund categories are exhibiting similar but muted net cash flow trends to those recorded at this time last year. However, equity ETF net cash flows, both U.S.- and foreign-focused, remain flat in contrast to last year’s strong start. Nonetheless, the definitive shift in trend from bond to equity funds which began midway through 2013 is still intact.
Outflows From Equity & Bond Funds

Outflows From Domestic Equity & Bond Funds Continue; Foreign-Focus Funds Still See Inflows.
Second Week of Equity Fund Outflows

Net cash outflows from bond mutual funds are not letting up; we've seen fund outflows in 25 of the past 27 weeks, with this week's estimated net outflow at $5.6 billion.
Supply/Demand Factors - October 2013

YTD net flows have remained in positive territory by about $10 billion.
An Update On Fund Cash Flows In 2013

The late 1970’s bull market has some eerie similarities, and sentiment reflects Main Street’s newfound bullishness. Plus a look at January fund category flows gives us some points to ponder.
Fund Flows Not Quite As They Appear

Despite flows out of U.S. focus equity mutual funds, investors remain heavily invested there; while dollars flood into bond funds, they’re also flowing into other varieties of equity funds.
Second Helpings… Will There Be Leftovers After Financials Leave The Table?

We have maintained that the mere fact that the Financials sector has been successful in raising capital via new equity issuance in the stock market is a good sign that the system is stabilizing. The aftermarket support for these deals indicates a healthy secondary market, and furthermore, points to the presence of ample stock market liquidity.
Four Trends Worth Knowing About On The Supply/Demand Front

Four trends worth noting and their implications for 2008.
Stock Market Supply/Demand: The Four Most Interesting Trends Of 2005
In reviewing the numerous Supply/Demand factors we track, there were four trends that are perhaps the most important and/or most interesting on this front so far in 2005.
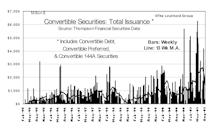
Convertible Offerings...The Stealth Supply Factor
With convertible issuance in 2003 running almost 23% ahead of common equity issuance, we thought it would be a good time to take a look at this subject.
Convertible Offerings….How They Affect The Stock Market Supply/Demand Equation
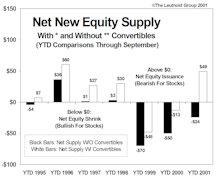
In the context of Supply/Demand considerations, convertible offerings represent a potential increase for equity supply down the road.
Convertible Offerings….How They Affect The Stock Market Supply/Demand Equation
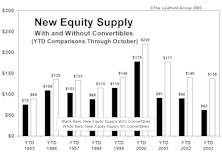
A comparison of stock market net new equity supply with and without Convertibles.
Stock Market Supply/Demand

U.S. focus equity fund net inflow of $15 billion is estimated for May, which is somewhat less than the $17.5 billion net inflow in April, but somewhat more than $13.2 billion net inflow last May.
Have Increased Equity Exposure

Our Aggressive Stance On Equity Exposure: Fed cuts, money supply expansion, tax cut prospects, fund inflow, and market internals.….Not all worries have gone away, however. This bear market has not followed what can be thought of as a traditional course.
October Mutual Fund Flows: Amazing How Main Street Keeps Buying

Supply/Demand wildly bullish—wo why isn’t the market going up? A look beyond the supply/demand dynamics factors.
September Mutual Fund Flows: Main Street Investors Staying The Course

· It really is incredible that equity fund inflows have held up so well this year. Also, Supply Factors: Heavy cash acquisition activity is bullish for stocks, since it reduces the overall equity supply available to investors.
August Mutual Fund Flows: Main Street Investors Staying The Course

The YTD $194 billion net inflow through the end of August is now 67% more than 1999’s $116 billion net inflow over the same YTD period, and has already matched the annual record (1997’s $194 billion). Supply/Demand: Offerings volume was very heavy during the first half of August, but began to dry up in the second half of the month.
July Mutual Fund Flows: Main Street Investors Remain Mostly Unfazed By Market Declines
One thing can be said about the equity fund money flow this year: it just keeps rolling in.
Supply Factors

YTD offerings of $120 billion have been overtaken by $142 billion in YTD cash acquisitions.
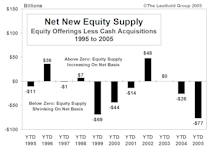
Net New Equity Supply

YTD offerings of $107 billion have been overtaken by $108 billion in YTD cash acquisitions. This produces net equity shrink of $1 billion so far this year.
Net New Equity Supply

A net increase of $30 billion in new supply this year. Quite a reversal from 1999 where YTD $39 billion of new offerings was almost 50% less than cash acquisitions.
View From The North Country

Transcript from late February conference call with Steve Leuthold and Byron Wien covering a wide spectrum of timely investment topics.
Major Stock Market Positives and Negatives

Steve’s personal judgements and opinions incorporating observations, experience and gut feelings, going beyond the quantitative aspects of the Major Trend Index disciplines.
Major Trend Back to Negative

Major Trend back to Negative...Both Asset Allocation Portfolios shifted to their most defensive posture ever. Steve's judgements and opinions on major stock market positives and negatives.
Should We Believe It This Time?

On June 22, clients received an Interim Memo noting that our composite Major Trend Index had slipped to Negative status. The subsequent calculation lost a few more points and remains marginally negative.
A Look In The Rearview Mirror
Thanks to the quantitative disciplines (Sector Selection Scores), sector calls and shifts in equity portfolios were mostly on the mark in 1996...except for bad late 1995-1996 Playing The Bounce episode.
How Significant Are Buybacks?...A Summary

While stock is being repurchased through the front door, additional shares are going out the back door for stock options, incentive compensation, and acquisitions.
A Major Market Top in the Making

Since turning negative on July 2, the Major Trend Index has deteriorated very rapidly. Major stock market top now seems to be developing. There are now five stock market positives and seven negatives.
What Has Changed Since February 2, 1996?

Comparison between February 2, 1996 Major Trend (when we last went positive) and today’s calculation shows the shift primarily driven by Economic/Monetary/Inflation (higher interest rates), and by the Supply/Demand category.
Major Stock Market Positives and Negatives

A review of the significant stock market positives and negatives as I currently see them. There are now five major positives and five major negatives.
Leuthold Investment Strategy

With MTI turning positive, total equity exposure was increased to over 50% (now 58%) using index options to minimize and reduce risk...“new valuation era” continues...demand for U.S. equity funds continues to be key driver.
Major Stock Market Positives and Negatives

During the month of January, two major stock market positive factors became more positive, three remained about the same, and one became less positive. Among the four negative factors, all four became more negative.
Leuthold Major Trend Index: Revisions Are Overdue

Major Trend Index modification will be made this week...weights of two mutual fund inflow components will be doubled due to their significance.
Supply/Demand Considerations

Record demand meets record supply. September could be a crucial month.
Perception for the Professional
March 2026 Issue

Featured Articles
Sector Navigator
March 2026 Issue
