Weighting
Schrödinger’s Style Box
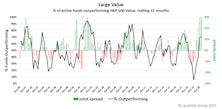
The performance derby between actively managed portfolios and passive benchmarks is strongly influenced by market conditions. Active manager success rates are cyclical, but not random, and are driven by slippage created from style, size, and weighting considerations that result from the imperfect slotting of active portfolios into single style boxes. Moreover, this slippage can be defined and measured, and shows a clear correlation with relative return spreads between benchmarks and their opposite boxes.
Dow Performance: A Matter Of Weighting...
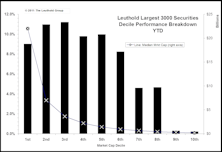
Are the Dow Industrials benefiting from trivial weighting? Slicing our Leuthold 3000 universe into market cap deciles shows different performance results than commonly followed market indices.
Weighted Versus Unweighted: Inside The S&P 500
In 2006, the capitalization weighted S&P 500 was up 13.6%, excluding dividends. The average return for the 500 stocks (S&P equally weighted) was up 14.2%.
S&P 500 Energy Weight Is Misleading: Fewer Constituents, Not Less Market Cap
S&P 500 Energy weight is misleading. Adding the largest multi-national integrated oil companies to the S&P’s 10% energy weight doubles it to 20%.
Recent S&P Sector Weight Trends Within The Current Bull Market
The S&P 500’s largest and most rapidly increasing sectors.
Large Cap Versus Small Cap
Small caps continue to be the market leaders over large caps. This trend is expected to continue into 2005, as our small cap leadership model has recently improved, and is now rated slightly positive.
Sector Spotlight: Health Care Watch
The near term is becoming more uncertain for Health Care stocks, as HC groups have experienced an erosion in GS Score strength.
Sector Spotlight: Health Care Watch
We view Health Care as a key theme in 2004. The sector is defensive and sports high growth rates thanks to the large (and growing) demand from elderly Americans.
Sector Spotlight: Health Care Watch
There was a brief pause last month in our Health Care scores, and we were proceeding with caution. This month, our GS Score work regained some of that lost momentum.
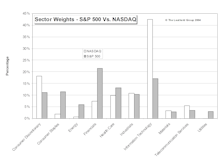
NASDAQ vs. S&P Market Weights
Comparing the sector weights between the NASDAQ and the S&P 500.
Sector Spotlight: Health Care
Conceptually we think that the big drug stocks are poised to rebound, but they have yet to rank Attractive in the Group Selection Scores.
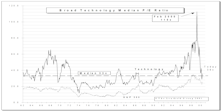
Tech Watch
The broad Tech sector has rallied significantly from lows and is not cheap by traditional valuation measures. Upside driver is earnings momentum, which continues to be strong.
Historical Swings In S&P 500 Sector Weights
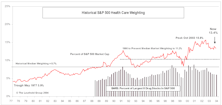
A look at favoritism shifts in broad economic sectors, 1977 to date. Large weights prone to correction.
Answering Client Questions
Each month, we get a number of client questions via meetings, phone calls, and e-mails regarding various aspects of our research.
The Case For Cutting Back On Financials
Expect the S&P 500 financial weighting to fall to 14% or so over the next two years, as they underperform the overall S&P 500 index.
The Big Swings In S&P 500 Sector Weights
History shows us a number of economic sectors besides technology which have also experienced broad swings as the tide of investor enthusiasm ebbs and flows.
Answering Client Questions
We always welcome the chance to hear what’s on our readers’ minds, and have often found that seeking answers to these questions can lead to new research topics, interesting charts, and new ways of looking at things.
Tech Watch…..S&P Tech Subset Down 5% In July
Worse than expected Q2 earnings (losses) beat down the tech sector in July. The bad news just won’t end.
Tech Watch…..Tech Turns Up In Late June
After weathering a big correction in March and early April, Tech stocks have recently acted pretty well considering the dismal earnings and worsening outlook.
Tech Watch…..Weak In May
Tech stocks struggled again as a torrent of disappointing news showered the group in May.
Tech Watch…..Strong Bounce In April
Tech stocks came roaring back in April (Info Tech sector up 22%), but don’t expect another parabolic rise!
Index Sector Weights and Comparisons With Sales and Earnings
New series compares index industry sector weights with sales and earnings contributions.
Tech Stocks Approaching "Normal" Valuations
S&P 500 tech weighting has plunged 43% from February 2000’s peak of 34%. Now at 19%, but expect it may have further to fall in 2001.
Tech Stocks: Valuation Considerations Now
The underlying decline in valuations and tech stock weightings in the cap weighted market indices probably has further to go in 2001.
S&P Technology Weighting Falling
S&P Technology Weighting has fallen to about 21.9% from nearly 35% in February. Expect it to fall to 20% or below (recession?) within the next year.
Large Cap Versus Small Cap: Inside The S&P 500
Poor performance by Large cap technology issues had a very negative impact on S&P 500 cap weighted performers in 2000.
Technology: What’s The Downside?
November was Tech nightmare but we think about two-thirds of decline is behind us.
Technology: What’s The Downside?
Not even the mighty techs are immune to saturation, overcapacity, cyclicality, and fierce competition.
1999 Performance: Big Caps Versus Small Caps
Small cap performance actually nosed out Big Cap +19.6 for Russell 2000 and +19.5% for S&P 500 (price only). Who would have believed it?
The Dow Jones Industrial Index...Before and After
Dow Jones gets a Tech infusion. Still not up to S&P 500 Tech weight.
Beating The S&P 500...Q3 Update
Large Cap and Growth was where you needed to be in the first nine months of 1999.
The Dichotomy Continues...Big Cap Versus Small Cap
Q1 1999 following the same market script of 1995-1998, with big cap stocks, especially Nifty Fifty types, dominating smaller companies in terms of market performance.
Small Caps Relatively Cheap, But….
Small caps cheap relative to big caps, but neither is cheap on absolute basis...Unweighted to weighted P/E comparison at record discount.
DJIA Economic Sector Weightings…A Different Perspective
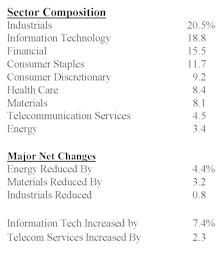
The four March changes in DJIA components shifted sector weightings for the index, most significantly in Energy, Financial, Healthcare and Technology.
A Sector Dissection of the S&P 500
Jim Floyd’s breakdown of eleven broad sectors within the S&P 500. The S&P 500 experienced 24 component stock changes during 1996. New component additions were not balanced within the sectors by the stock deletions.
The Underowned and Overowned
Each quarter, Barron’s publishes an industry and sector breakdown of institutional holdings, as tabulated by Indata. This is the first time we have published this work, but we have been using it as a factor in our Sector Selection Scores.
