Yield Spread
1966-67: When The Yield Curve “Failed”
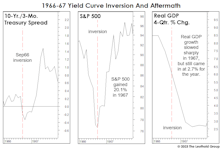
Given the tendency of economists and strategists to dismiss the message of an inverted yield curve, it’s surprising there’s been no scrutiny of the “dog that didn’t bark”—the inversion of 1966. That’s the last time an inverted curve did not lead to a recession.
Which Yield Curve?
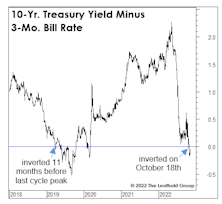
Last month’s inversion in the 10-Yr./3-Mo. Treasury spread further tilts an already lopsided scale in favor of a U.S. recession in 2023. That spread has been considered the gold standard from an economic forecasting perspective, and is the basis for the New York Fed’s Recession Probability estimate (which, by the way, should break above its critical 35% threshold when it’s published later this month.)
Looking “Bustier?”
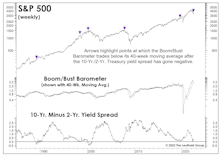
Key indicators are indeed trending in “pre-recessionary” fashion. Among them is the ISM New Orders Index, which dipped into contraction territory in June while inventories increased. Others are the JOLTS that shows a strong (but weakening) labor market, and unemployment claims—which have ticked up.
The Terrible “Two-Year”
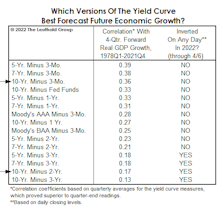
In a simple test of 15 yield-curve variants, we found that the 2s10s spread ranks second to last, based on its correlation with one-year-forward real-GDP growth since 1978. The three best measures employed the 3-month bill as the “short” rate. The spread between the 5-year note and 3-month bill showed the strongest correlation with subsequent economic growth.
Perception for the Professional
March 2026 Issue

Featured Articles
Sector Navigator
April 2026 Issue
