Breadth Thrust
Small Caps Missed The Memo
For the first time since 1946-47, the super-bullish, six-month window beginning with the mid-term elections through the following April, failed to see a material upswing in Small Caps.
A Thrust Is Not Enough
The S&P 500 rally off last October’s low reached +16.9% at its peak on February 2nd. That’s well below the largest post-WWII bear-market rally of +24.2%
Checking In On The Rally At The Six-Month Point
Yesterday was the six-month anniversary of the bear market low of 3,577.03 in the S&P 500. We think it’s unlikely the moderate upswing since then represents a new cyclical bull market. However, with the evidence still weighing in at Neutral, we’re not betting the farm on that opinion.
Pause, Then “Paws?”
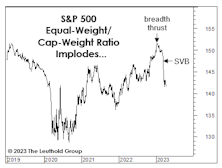
Despite the Fed’s tough-talk about getting the funds rate above 5%, monetary and liquidity measures are significantly less bearish. Thank SVB depositors, who required a bailout big enough to reverse five months of QT in just two weeks. The market reaction looks like that after September 2019’s Overnight Repo-market turmoil, which forced the Fed to end its first experiment with QT.
Another Thrust, Right On Schedule
Among the latest bullish cues, we’d put the most weight on the MBI breadth-thrust signal because it’s the only one among a variety of measures we track that hasn’t falsely triggered during a bear market. Perhaps its first misfire is imminent.
Is This Year’s Strong Start “Signal Or Noise?”
This year is off to a much stronger start than suggested by the 3-4% gains in the blue-chip averages: Through January 12th, the Value Line Arithmetic Composite—an equally-weighted index of about 1,700 stocks, was up 7.0%.
Another Misfire?
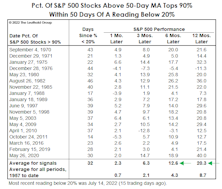
A signal from the newest addition to our Technical category seems to have gone awry. On November 30th, the percentage of S&P 500 stocks trading above their 50-day moving average topped 90%, thereby issuing the second “breadth-thrust” signal in four months.
Don’t Trust The Thrust…
Jay Powell’s speech on November 30th triggered a 1,000-point intraday reversal on the DJIA and left us wondering who might have slipped the Chairman a recent copy of the Green Book.
Jay Powell, The Chartist
When Jerome Powell took the reins of the Federal Reserve in early 2018, many commentators cheered the fact that he does not possess a Ph.D. in Economics. It will be many, many years before historians are able to conclude whether that’s a good or bad thing.
Yesterday’s action, though, left us wondering whether Powell might stealthily be in the process of earning a different designation—that of Chartered Market Technician (CMT).
Here We Go Again...
No surprise here—October’s rebound put technicians on alert for a “breadth thrust” for at least the fourth time since the bear market began in January. On the whole, technicians have performed better than most this year, but their obsession with new and creative ways to capture the thrust phenomenon is a sign that even this normally flexible crowd is eager to get long(er) as soon as possible.
From “Thrust” To “Bust” In Three Weeks
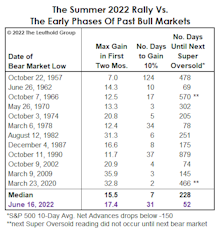
If a new bull began in June, the August 31st “super-oversold” signal would be the first ever during the first three months after a bear market low. In 1962, such a reading occurred in the bull’s fourth month—which is probably why some analysts are now using that year as a possible analog for the rest of 2022.
Fake-Out Or Break-Out?
“Don’t fight the Fed” was profitable advice dispensed almost daily by bulls in the 2nd half of 2020 and all of 2021. It’s been valuable advice in 2022, as well. However, when the Fed turned hostile earlier this year, the bulls deviated from their own sound advice and looked for new narratives.
The Rally: Impressive, But Not Yet “Thrust-Worthy”
Many technicians contend that the rebound off June’s lows triggered a bear-market-killing “breadth thrust.” Several gauges we monitor to capture this phenomenon contradict that claim. None has reached a threshold that is extreme enough to qualify as a thrust.
Nothing Close To A “Thrust”
Many technicians claim that the rallies of late March and late May generated impressive “breadth thrusts.” We’re skeptical: We’ve tested many tools that attempt to capture such a phenomenon, and found that the most reliable thrust signals aren’t ones that show up every couple of months.
2020 Post-Mortem
This summer marks the first anniversary, not of the COVID-19 stock-market low, itself, but of the much belated “confirmation” of that low.
After The “Thrust”…
We’re concerned that cyclical groups, which normally catch fire after a breadth thrust, are tracking along the bottom (or below) the previous worst-case outcomes following identical breadth-thrust signals.
Should You Trust The Thrust?
There are two concerns with the latest bullish thrust signal, with one, in part, causing the other. First, the S&P 500 return preceding the MBI thrust signal was +42.8%, almost triple the average slippage of +15% associated with all prior signals.
Should You Trust The Thrust?
During the first two months of the rally (and +30%) off the March lows, we noted that the usual cyclical leaders of a new bull market were underperforming on a relative basis, and there had been nothing even close to the “breadth thrust” that often accompanies an initial bull market up-leg.


.jpg?fit=fillmax&w=222&bg=FFFFFF)


.jpg?fit=fillmax&w=222&bg=FFFFFF)


.jpg?fit=fillmax&w=222&bg=FFFFFF)


