Coppock Curve
VLT: You Read It Here Last
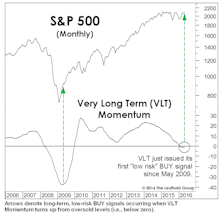
We anticipated it for months, and now that it has finally happened, we’re burying the news in the final page of this section. Yes, the last day of March saw the S&P 500 trigger a “low-risk” BUY signal on our Very Long Term (VLT) Momentum algorithm, known elsewhere as the Coppock Curve.
Not Much “Lift” From VLT “BUY”
In the June Green Book, we professed some skepticism surrounding the long-term, “low-risk” BUY signal for stocks that was triggered at the end of May by our Very Long Term (VLT) Momentum algorithm (also known as the Coppock Curve).
More Upside For Small Caps?

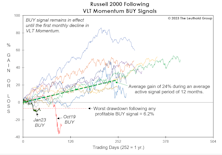
There was a major cyclical BUY signal (VLT Momentum) for the S&P 500 in late-May, and as of July’s close, that bullish development was reinforced by a new VLT BUY signal on the Russell 2000.
VLT Says “BUY”
Breadth underlying the 4-month upswing has been stronger than that observed during any other rally leg since 2013. Despite just a 14% correction in the S&P 500 from its peak, a new VLT “BUY” signal was triggered. Failed signals are relatively rare, the last one occurred in December 2001.
A Few Thoughts (And A Lot Of Charts) On The Oil Collapse
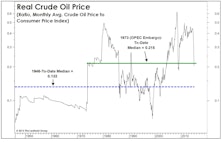
Has the recent collapse in crude oil prices presented us with a good opportunity for an outright commodity investment? No. Energy stocks aren’t on our radar screen either.
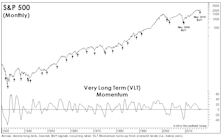
The VLT Momentum Indicators…..New Buy Signals On S&P 500 & DJIA

VLT Momentum, a long term technical measure, recorded buy signals on S&P 500 and DJIA. This is a very reliable indicator.
De-Mystifying VLT Momentum

An explanation of VLT Momentum (The Coppock Curve); what it is and how we use it.
View from the North Country

Speaker Notes from Collins Associates Client Conference...The Passing of Two Good Friends, Jim Arnold and Sedge Coppock...Other Voices on Program Trading...What Is Going on In Gold
Perception for the Professional
March 2026 Issue

Featured Articles
Sector Navigator
March 2026 Issue
