Corrections
The 2021 Speculative Mania And Its Aftermath
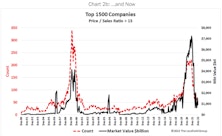
One of the societal benefits of recessions and bear markets is that they serve to correct the unhealthy excesses that build up in overheated economic booms and overly enthusiastic bull markets. As market historians, we believe it is instructive to look back at cycles of excesses and their corrections to learn how such patterns evolve and, quite often, repeat themselves.
The Housing Market Is A Trip!
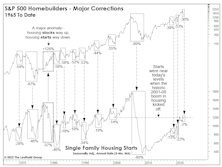
In mid-May, S&P 500 Homebuilders officially became a COVID “round-tripper”: After a one-month COVID collapse of 53% and an ensuing rally of almost 250%, this year’s selloff drove Homebuilders to a May 11th close that was a few ticks below its pre-COVID high. Imagine what might happen if the housing market cracks?
Special Study: Should You Buy The Dip? Some Statistical Considerations…
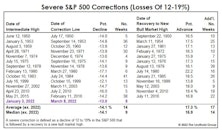
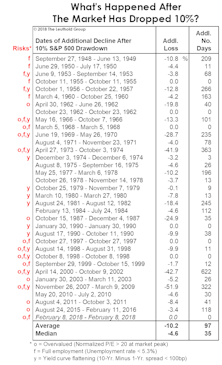
The correction in the S&P 500 since its high on January 3rd qualifies as a “severe” correction, which we define as a decline of at least -12% based on daily closing prices. What are the odds that it becomes a “major” decline*—in which the loss exceeds -19%?
In Section I, we review the history of severe corrections since 1950. In Section II, those corrections are analyzed in the context of the economic cycle, consumer sentiment, and other underlying factors—ones that might help us determine if today’s stock-market weakness is “buyable.”
The Market Is Off Its Meds!
.jpg?fit=fillmax&w=222&bg=FFFFFF)
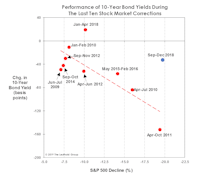
Well before the war drums in Eastern Europe began to beat, this stock market correction had already been marching to a different beat. The market’s confusion might be understandable, because—unlike during most of the post-GFC corrections—it has so far failed to “self-medicate!”
A persistent feature of stock market declines in the past 13 years has been that they have typically triggered a simultaneous falloff in bond yields.
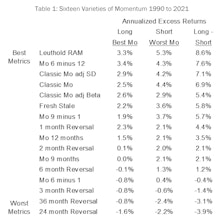
Can Mo Outrun A Bear?
Hiker #1: Can you run faster than that hungry bear looking at us?
Hiker #2: I don’t need to run faster than the bear, I just need to run faster than you.
The Momentum style of investing has a long history of generating excess returns, and ranks near the top of the list of essential smart beta factors. However, Momentum also has a dark side; it is prone to severe drawdowns whenever the market makes a significant reversal.
The “Tape” Doesn’t Always “Tell All”
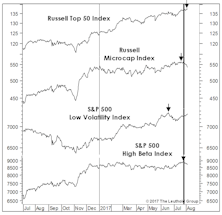
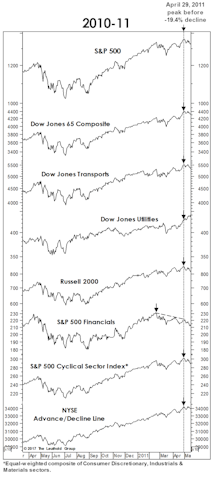
Technicians are collectively bullish because of the absence of any serious internal divergences. But, severe corrections can erupt with little, or no advance warning from a deterioration in breadth and leadership. In fact, the first few years of the last bull market provided two such examples (mid-2010 and mid-2011).
Foreign Stocks Party Like It’s The “2010s”
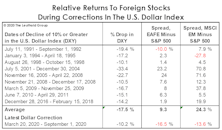
The most likely catalysts for improved relative performance of foreign stocks would be: (1) a bear market; (2) a recession; and, (3) a major downturn in the U.S. dollar. This year has supplied all three, yet the relative strength ratios of most foreign equity composites continue to grind lower as if it’s “business as usual.”
Bull Markets Are In The Eye Of The Beholder
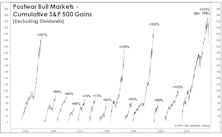
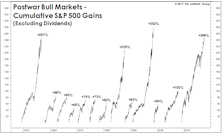
The market’s four-month recovery from the brink of a bear was completed in April, and the ten-year-old bull looks better than ever against all of its post-World War II competitors.
Partying Like It’s 1998-99
.jpg?fit=fillmax&w=222&bg=FFFFFF)
We thought Jerome Powell’s “Christmas Capitulation” would be tough to beat, but he accomplished that two days ago with what could be called his “Spring Surrender.” That, in turn, has rekindled hopes of a stock market melt-up along the lines of 1998-99, which, as old-timers will remember, followed a late-cycle correction that was nearly identical to the one seen last year.
The Correction In Historical Context
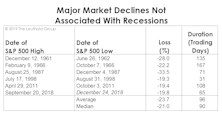
While it’s too early to let the ink dry on the accompanying table and chart, we’ve decided to add last year’s decline for comparative purposes.
A High-Risk Rally
During the market bounce over the last few weeks, we reminded ourselves and others of the old maxim that “bear market rallies look better than the real thing.” Evidently, the stock market overheard us and took the advice as marching orders.
Leuthold Quick Takes: Cyclical Bear Or Recovery Refresh?
The fourth quarter selloff and subsequent rebound, as seen by Doug Ramsey (Chief Investment Officer) and Jim Paulsen (Chief Investment Strategist).
Leuthold Quick Takes: Cyclical Bear Or Recovery Refresh?
The fourth quarter selloff and subsequent rebound, as seen by Doug Ramsey (Chief Investment Officer) and Jim Paulsen (Chief Investment Strategist).
The Market Is Off Its Meds!
While investors obsess over the market level at which a hypothetical “Powell Put” might come into play (or whether such a put even exists), they seem to have overlooked the absence of another such put that proved dependable throughout the cyclical bull market.
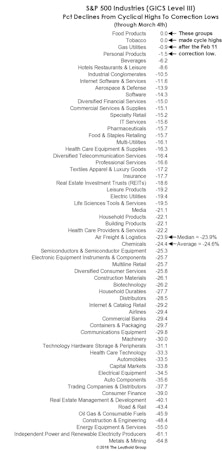
Correction Creating Values?
.jpg?fit=fillmax&w=222&bg=FFFFFF)
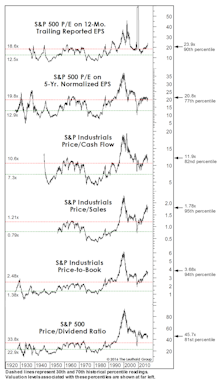
While the consensus view remains that October’s stock market rout was “healthy” and “overdue,” we think it was more likely the first leg down of much larger decline. But it’s still worth reviewing the improvement in valuations that market losses and this year’s excellent fundamentals have combined to produce.
Goldilocks, Meet The Three Bears
.jpg?fit=fillmax&w=222&bg=FFFFFF)
During the stock market’s protracted retracement of its January/February decline, we speculated a few times that the final outcome might look similar to the bull market tops of 1990, 2000, and 2007.
Breakout Or Fake-Out?
The S&P 500 has fully erased its January and February losses, but there’s probably a market message in the fact that it took so long to do so.
Assessing The Correction
How do today’s cyclical conditions stack up with those accompanying other stock market declines?
A Launching Pad??
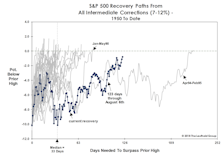
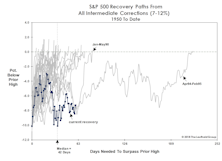
A few clients pointed out that the longest-ever recovery from an intermediate correction (Apr. 1994–Feb. 1995) became the base from which the S&P 500 would eventually triple over the next five years. We’re not equipped to address that possibility in an objective fashion, so we’ll let you be the judge.
Trouble Is “Spreading”
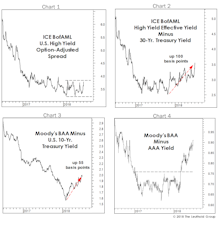
Junk bond option-adjusted spreads (OAS) have remained relatively tight throughout the stock market pullback and recovery (Chart 1), assuring some bulls that the action is nothing more sinister than a “healthy and overdue” correction.
Where’s The Spring In The Step?
Old age alone may not kill the bull, but it can make it more susceptible to an array of life-threatening maladies.
Is The Bull Just Napping?
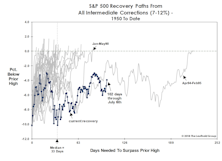
Old age has certainly put no limitations on the bull’s exploits, so we should be cautious in reading too much into its meandering recovery path. However, it’s possible that action since the February low is not a recovery process but rather a countertrend bounce within a larger downtrend.
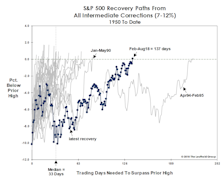
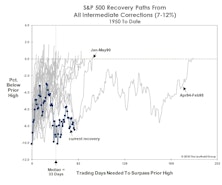
The “Correction” Clock Is Ticking
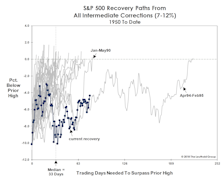
2018’s S&P 500 setback qualifies as an “intermediate” correction. Historically, the duration of intermediate corrections is brief, and recovery time to move back above prior highs has also been brief. This year’s retracement route is already among the most meandering of all recovery paths since 1950.
Market Corrections And The Hazards Of Old Age
In difficult markets, we have become more appreciative of some of life’s small gifts. For example, it’s been quite a while since we’ve heard it argued that this is “the most hated bull market of all time.”
Assessing The Selling
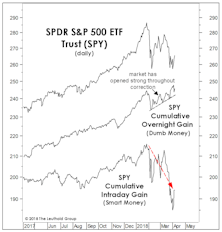
While the January 26th bull market high illustrated none of the hallmarks of a major cyclical top, there are secondary signs that a stealthy distribution process may be underway, such as an overwhelming bias toward opening market strength followed by intraday weakness.
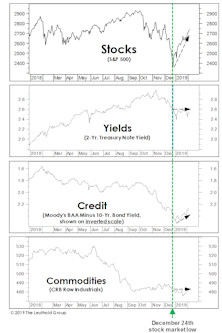
A “Drug-Free” Market Decline?
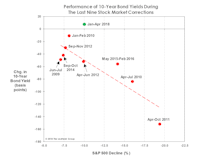
Yields on 10-year Treasuries are up 10 bps since stocks peaked in January, a clear break from the behavior of prior corrections. The last four stock declines of 10%+ were self-medicating—having been accompanied by bond yield declines of 50 to 150 basis points.
“What, Me Worry?”
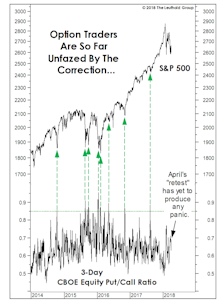
Our shortest-term put/call measure has yet to reflect the level of fear usually triggered by a correction of this size. Meanwhile, the market setback has done almost nothing to stymy the optimism of either market newsletter writers or mutual fund timers.
What’s Ailing Consumer Staples?
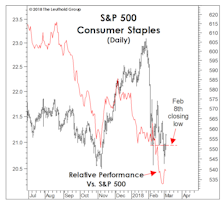
For the first time in this bull market, defensive stocks failed to provide any semblance of defense during a market correction.
Nine Corrections In Nine Years
The stock market’s nine-day decline off its January 26th high met our definition of an intermediate correction—an S&P 500 loss of between 7-12%.
The Correction That Scared No One
The setback from the January 26th market peak represents the ninth correction of 7% or more since 2009, the most ever recorded during a single cyclical bull market.
Stock Market Observations
We believe the decline from the broadly-inclusive market highs of late January is a yet another late-cycle correction and not the first installment of something more sinister.
Most Likely Just A Correction
So, what happened to the January Barometer—the old analyst’s maxim that a market gain in January portends a gain for the full year?
2018 Time Cycle—Beware A Fall Correction
The most common 2018 time-cycle pattern among major markets is a fall correction, with the U.S. and Japan faring better than their European counterparts.
Stock Market Observations
The S&P 500 and DJIA were up 10-11% on the year through early August—solid, but not quite the “melt-up” scenario we’d envisioned earlier this year…We think S&P 500 2,550-2,600 will be achieved, but not until year-end…
Cashing In A Few Chips
Through early August, the S&P 500 had matched last year’s total return gain of 12%, while futures on that index have gained more than 20% from their after-hours lows made on election night.
What A Strong “Tape” Does (And Doesn’t) Mean
Our disciplines remain bullish, but we periodically wonder whether we’re being too cavalier in keeping our tactical portfolios “almost” fully-invested (at 65% equities) in the face of valuations that are higher than those seen in all but perhaps 24 months of stock market history.
Valuations: The Correction That Never Was
The correction failed to meaningfully “reset” any long-term valuation measures, hence, we don’t view the current environment as having much investment merit, but rather, primarily speculative appeal.
Ruminations On The Correction
If our market disciplines turn bullish in the weeks ahead, we’ll certainly follow that lead—covering remaining shorts, re-establishing a semi-aggressive market position, and wiping egg off our faces for having called a “cyclical bear market” that slammed the Russell 2000 (-26%), EAFE (-26%), and Emerging Markets (-37%)… but somehow not the one most followed, the S&P 500 (-14%).
Just A Costly Correction?
If February 11th marks a lasting low for stocks, the 2015-16 decline will go down as one of the costliest in history not to have reached bear market status.
Beware The Deceptive S&P…
At its January 20th closing low, the S&P 500’s peak-to-trough decline of –12.7% barely met our definition of a severe market correction (an S&P 500 loss of 12% to 18%). But the behavior of this particular index can be quite sinister during the final phase of a bull market—and during much of the ensuing bear.
Perception for the Professional
March 2026 Issue

Featured Articles
Sector Navigator
March 2026 Issue
