Divergence
Can The Rally Recover From Its 0-For-8 Start?
The current rally is either the first upleg of a new bull market, or the second-largest bear market rally in the last 125 years. The lone development that can settle the issue is for the S&P 500 to move above its February 19th closing high of 3,386.15.
Out Of The Blue?
There have been long-time divergences between blue chips and other market segments signaling that all is not “in gear” beneath the surface—but this cautionary activity never foretells the “timing.” Recently, Small Caps, the Value Line Arithmetic Composite, and Dow Transports staged pathetic bounces off the January 31st “Coronavirus 1.0” low, while the blue chips had strong momentum into mid-February. Normally, such divergences typically last for at least 3-4 months before they become meaningful.
August Is No Time To Disconnect
Rather than stocks disconnecting from the economy, as some equity bears contend, we see the blue chips disconnecting from the rest of the market. The underperformance of leading groups, along with multimonth divergences in momentum, bullish sentiment, and credit spreads are all consistent with the deteriorating prospects for earnings and the economy.
Divergence, Danger, And Delusion
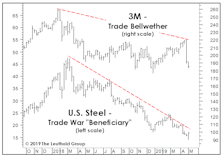
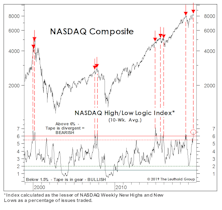
The U.S. economy and blue chips have shrugged off the risk of the worst trade war since 1930’s Smoot-Hawley Act, while comparatively few stocks on either the NASDAQ or the NYSE have broken out to 52-week highs. There’s also the troubling talk of the Fed having tamed “the cycle.” Should investors bet on a potentially wild (but narrower) final melt-up over the next 6-12 months? We don’t like the odds.
Divergence Everywhere—A Cross-Asset View
The 40 bps jump in the 10-year yield, a 2-standard-deviation event, occurred within a five-week win-dow. Interestingly, historical data doesn’t suggest a continued increase in the near term.
Narrow Performance Divergence Among EM May Not Last
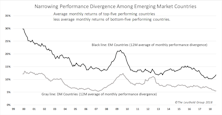
We’ve previously noted the narrowing performance divergence between top- and bottom-performing Emerging Market (EM) countries in recent years.
Stock Market Observations
We remain bullish on stocks but with very limited visibility into 2018.
Another Leg Down In Crude?
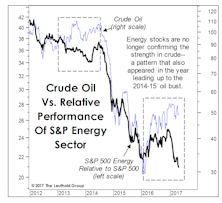
Remember the special amplifiers used by the fictional rock group Spinal Tap that could be dialed up to eleven? S&P’s decision last year to designate Real Estate as a full-fledged sector means that our GS rankings can now be dialed down to eleven, and unfortunately the Energy sector has been a frequent occupant of that undesirable spot.
Divergence Among Quality Factors
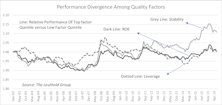
Performance and valuation of the three Quality factors are diverging. From a valuation standpoint, we might see a reversal in performance, with the Stability factor weakening and the Leverage factor strengthening.
Low Vol Divergence, Episode 3
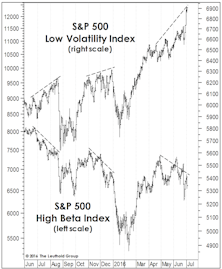
The divergence between S&P 500 Low Volatility and High Beta Indexes has emerged for the 3rd time in a year. The 3-month performance spread is even more extreme than it had been on the eve of either the August or December stock market air pockets.
What’s Driving EM Currency Weakness?
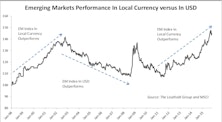
A strong dollar and low commodity prices are major forces dragging down EM currencies across the board.
August Was No Anomaly
Stock Market Observations
The U.S. stock market has largely shrugged off the latest round of worries related to China’s stock market collapse, the new down-leg in crude oil, a more hawkish tone in Fed-speak, and sizable second-quarter declines in S&P 500 sales and earnings.
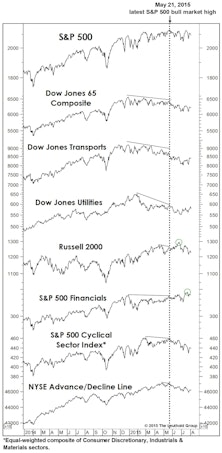
Value, Momentum, And The Stock Market Cycle
Conventional measures of market action, like breadth and industry leadership, point to the formation of a bull market top. Divergences abound.
Major Trend Moves To Neutral, But Not All Hope For The Bulls Is Lost

Deteriorating Technicals drove the move to Neutral, but a new positive reading in the Attitudinal category gives some hope to the bulls.
The Disappearing "Large" Effect And Emerging Market Performance
While U.S. stocks have surged this year, Emerging Markets have languished. What is going on in Emerging Markets to cause this unusual situation?
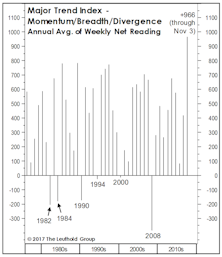
Momentum/Breadth/Divergence Category Moves To Negative Ground
With this category now breaking into negative territory, we thought it would be interesting to look back at the other periods when the Momentum/Breadth/Divergence category shifted from a positive net reading to negative.
Major Trend Index Negative

Bond market decline may be in find stages, but stock market can stilll fall 20%- 25%, even if bonds stabilize in coming months.
The Major Trend: Still a Bull

Down more than expected in May but the Major Trend Index remains decisively bullish. Early Warning Index at +10, -3, combined with sentiment and momentum work leads to a conclusion that current decline may be about over, with market rallying again later in June. Advise accumulation.
Perception for the Professional
March 2026 Issue

Featured Articles
Sector Navigator
March 2026 Issue
