DJIA
What Does The Dow Have To Say About A “New Bull?”
.jpg?fit=fillmax&w=222&bg=FFFFFF)
Yesterday the NASDAQ 100 closed up more than 20% from its late-December low, prompting the media to enthuse that it had entered a “new bull market!” Sadly, though, the “NDX” has no company among the broad indexes: During this NASDAQ move, gains in the S&P 500 and Russell 2000 have been just 6.5% and 2.9%, respectively, while the DJIA is down 0.5%. (So much for January’s “breadth thrust!”)
Calling “Bull” On Calls For A New Bull
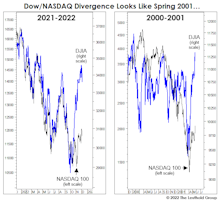
Seriously, another “new bull”—coming so quickly after this summer’s “new bull?” We’ll see. We’re not ones to dismiss price action, because stock prices, in and of themselves, are an important “fundamental.”
But we’ve seen the Dow go rogue like this once before, and it didn’t end well.
Putting Two Market Maxims To The Test
For decades, stock market observers have viewed January’s action as a harbinger for the rest of the year. Is there any merit to that belief?
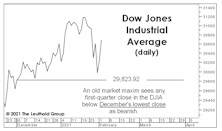
A “Low-Risk” BUY?!?
So what do we make of July’s “low-risk” VLT BUY signal on the DJIA—the index on which the indicator’s creator (Sedge Coppock) did his original work? Sadly, not much.
BAA Acting Baaaadly!
Whether or not they’ve risen for the “right” reasons remains up for debate, but the upward move in interest rates has hit the usual suspects very hard in 2018, like early-cycle industries and Emerging Markets.
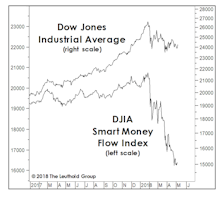
A Smart-Money Split
The Supply/Demand category carries the smallest weighting among the five factor groupings in the Major Trend Index, and this weighting is further diminished by the fact that its components rarely line up in a way which loudly proclaims that an “accumulation” or a “distribution” phase is underway. Today is just another of those typically inconclusive times.
The Market Told You So
First quarter profits have been terrific, and this quarter’s will be too. Enjoy them, but remember that the market “paid” you for them many months ago. Don’t submit another invoice…
This Is A Head-Scratcher
The longest and probably most complex bull market in history is not going to make a clean and decisive exit.
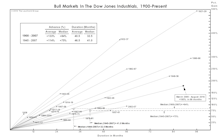
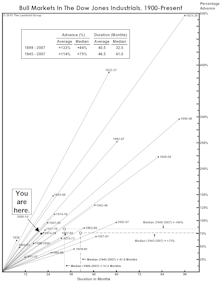
Happy 9th Birthday To An “Off-The-Charts” Bull!
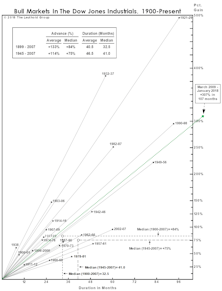
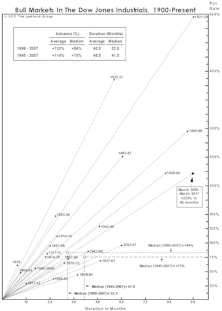
Last fall’s market rally drove the DJIA off (literally) our 1900-Present Bull Market chart. Within a year, this bull jumped two spots to #3 in the all-time rankings dating back to 1900.
The Smart Money Sleeps In
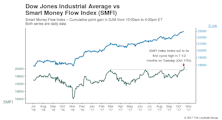
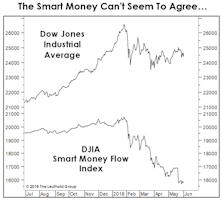
From a purely technical perspective, the bull market has hardly been lacking for feathers in its cap. Yet it earned another one on Tuesday when the DJIA Smart Money Flow Index (SMFI) broke out to a new bull market high (Chart 1), erasing a “non-confirmation” that had stood since March 1st. This index thereby joins the broad list of market bellwethers—chronicled in the last Green Book—that have participated in the parade of new highs.
Breaking The Pattern?
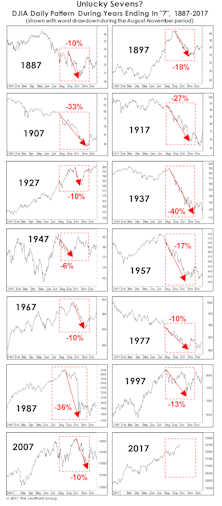
The Chicago Cubs’ break of the 75-year Billy Goat Curse last year might have warned us of the dangers inherent in historical pattern analysis.
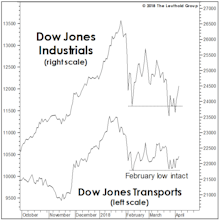
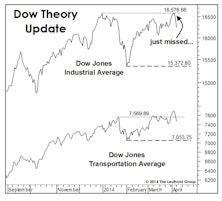
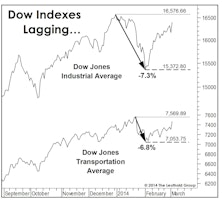
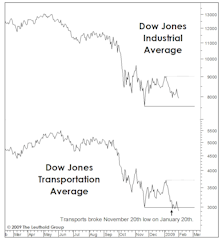
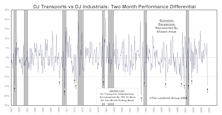
Troubling Transports?
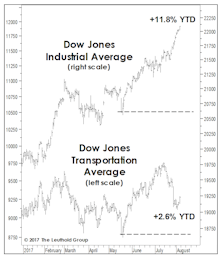
Does the last few weeks’ stumble in the Dow Jones Transportation Average foretell anything sinister? Not on the face of it.
A Subdued 8th Birthday Celebration
The hoopla falls short of that which surrounded birthdays #3-#7; based on the flood of assets into passive stock funds, it appears complacency has set in. Current bull close to becoming longest in history.
A Semi-Annual Checkup!
Call off the mortician, and bring on the pediatrician for the bull market’s 7 1/2-year checkup this month.
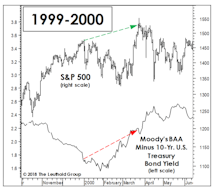
What Is The Bond Market Telling Us?
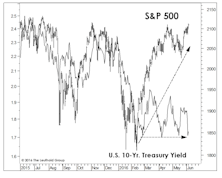
We’re tactically bullish, but among the twelve “Charts That Worry Us” published in the April Green Book, we’ll concede there are a few that still worry us.
A Venerable Monetary Indicator Turned Negative
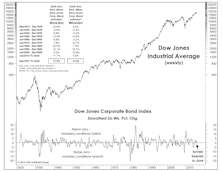
The smoothed, 26-week rate-of-change in the DJ Corporate Bond Index, a reliable indicator of monetary conditions over many different market and economic cycles, turned negative in mid-June.
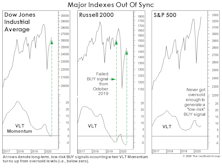
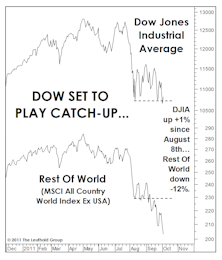
U.S. Markets See Uniform Strength, While The World Seems Fractured
Based on the historical percentages, the bull market should have a minimum of four to six months of life left. But the market has a way of throwing sand in the gears when you think you’ve begun to understand its internal mechanics.
Stock Market Observations
With our equity exposure high and our disciplines still tilting bullish, we’re naturally more concerned with what might go wrong than missing out on some kind of 2013 repeat.
Bulling Through The History Books
The Dow Jones Industrials’ bull market gain of +150% is well ahead of the long-term median (+86%) and average (+134%), and places the 2009-to-date move as the sixth-best all time.
Market Internals: The Good And The Bad
Leadership isn’t warning of impending weakness in either the U.S. economy or the stock market. Market breadth, on the other hand, is highlighting risks that aren’t evident when inspecting leadership alone.
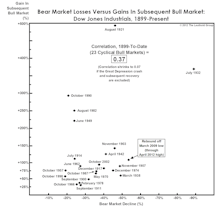
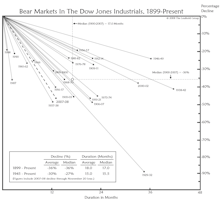
Bear Market Facts—A Refresher
This month’s “Of Special Interest” examines the bear market facts. Doug Ramsey doesn’t expect the current bear market to reach historical bear market medians in terms of decline or duration. Non-economic bear markets are usually much shorter than recession-induced bears.
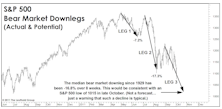
Worse Than It Looks… And Not Over
Most costly market decoy in the last six weeks has been unusual (relative) strength of the Dow and S&P 500 indexes. Resilience in blue chips is characteristic of the early and middle phases of a bear market, but recent blue chip performance has been so stellar (again, in a relative sense) that most investors curled up comfortably in the “correction” camp…while small caps, cyclicals and virtually all foreign markets were screaming “BEAR!”
The Bull Market’s Technical “Book Ends”
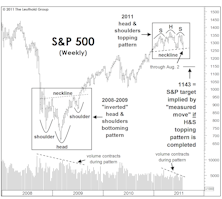
The 30-point collapse in the S&P 500 on Tuesday, August 2nd completed a bearish H&S pattern that has been several months in the making.
Dow Performance: A Matter Of Weighting...
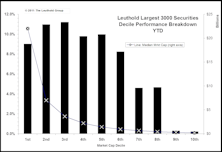
Are the Dow Industrials benefiting from trivial weighting? Slicing our Leuthold 3000 universe into market cap deciles shows different performance results than commonly followed market indices.
It’s Been Better Than It’s “Felt”
The latest bull market has now essentially matched the returns for all bull market recoveries dating back to 1900. Remarkably, it has accomplished this in only half the normal time frame.
Is There Trouble In The Transports?
The new low in the Dow Jones Transports is a bullish portent, but only if the Dow Jones Industrials can hold above their November low.
Struck Down By The "Killer Wave"
Last January we noted the appearance of a rare and dangerous technical configuration in the Dow Jones Industrials Average. Some analysts have described this topping pattern as the “Killer Wave”, and did it ever live up to that nickname in 2008.
Bear Market Epitaph?
While we can’t be certain that the final figures for the bear market have been booked, it’s worth putting the last 14 months of action into perspective.
Technical Comment: No Worries Over “Dow Theory?"
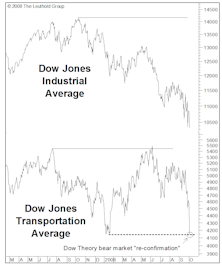
Dow Theorists looking at current market environment may be concluding stocks could weaken further. However, historically when confirmation from the Transports takes an excessively long time to develop (like it has currently), the technical pattern has actually provided an excellent buy signal.
Changes In The Capital Gains Tax Rate Vs. Stock Market Performance
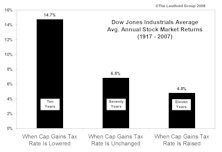
Prospects for increase to capital gains tax caused us to examine the historical impact such changes have on stock market performance, 1917 to date. The record is not very encouraging.
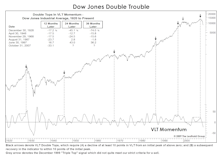
Dow Double Trouble
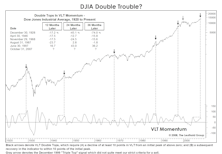
Our VLT (Very Long Term) Momentum algorithm—alternatively known as the Coppock Curve or “Madness of Crowds”—has just rolled over after forming a rare “double top” formation. Why has the rare VLT Double Top typically proven lethal for the stock market?
Breadth & Leadership: Bull Markets Rarely (S)Top On A Dime
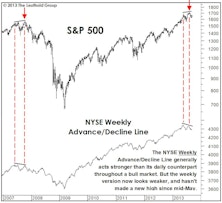
Market breadth moved down in tandem with stock market indices, but is not showing any divergences. All advance/decline lines were making new highs just before the downturn, and bull markets do not end with advance/decline data posting new highs.
Transportation Stocks As Economic Warning Signal
Six of eight recessions since 1957 saw signals registered by the Transportation Divergence monitor. Recent divergence may be warning of an impending economic contraction.
Steve The Technician

Last month, we had a request for technical readings on the major market indices. Being a long time card carrying member of the Market Technicians Association, I decided I should oblige.
View From The North Country

Full Disclosure (Reg FD), Investment Banking conflicts (hardly a recent development) and the Nikkei and DJIA: Will they cross this year?
The Dow Jones Industrial Index...Before and After
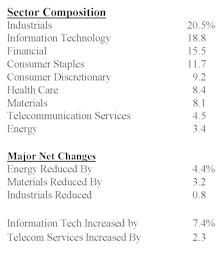
Dow Jones gets a Tech infusion. Still not up to S&P 500 Tech weight.
The Mixed Month Of May
The S&P 500 eased 2.5% in May, while measures of smaller cap stocks edged up 1% to 2%. Major Trend Index has shifted to negative status. Dow Jones 40,000?
First Quarter 1999: Only Indexers And Internet Players Liked It

S&P 500’s cap weighted 5% Q1 return overwhelmed most active manager’s returns.
The Mixed Messages Of January
It was a shaky 1998 start, but the U.S. equity markets got it together after the big hit on January 9th (-3%).
Perception for the Professional
March 2026 Issue

Featured Articles
Sector Navigator
March 2026 Issue
