Market Tops
These “Insiders” Have Exited; Should You?
What if the S&P 500’s September 2nd closing high were to miraculously stand as the cycle’s high-water mark? If it did, the peak was presaged—in retrospect—by two Federal Reserve Bank presidents who rode the liquidity wave all the way to its crest after assuring the floodgates would be left wide open. Both resigned in September.
The Short-Term Tea Leaves: Suddenly Wilting?
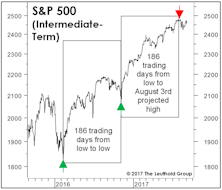
The “Nothin’ Matters” market lifted the S&P 500 to eight all-time highs in the nine trading days through July 7th. It’s been difficult to assail the stock market’s technical merits, but there are suddenly some short-term cracks among the handful of market indexes we consider “bellwethers.”
A New Take On Small Cap Valuations
For valuation work, we’ve traditionally favored the 1,200 company Leuthold Small Cap universe over the S&P SmallCap 600 because we get almost a full additional decade of perspective. But figures for the latter shed extra light on just how significant the revaluation in Small Caps has been.
Can New Reins Take Hold Of An Old Bull?
Three months ago, Large Cap Growth and Momentum were the winning ways to play the market; the long-time resiliency of these entrenched leaders was a cornerstone of the bullish case. Suddenly it’s Value and Deep Cyclicals leading, anything possessing Momentum, of late, has turned toxic. Ironically, this “new” leadership is now the foundation for the bullish reasoning.
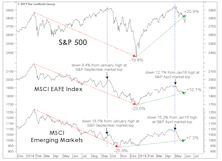
Portraits Of An Out-Of-Sync Market
We suggested many years ago that the final top to this historic bull market would be a long and complicated process rather than a clean and singular event.
Stock Market Observations
It’s telling that the stock market rally off of the Christmas Eve lows—impressive as it was (and, for some investors, painful)—did not manage to lift the Major Trend Index beyond its neutral zone.
Still Tracing Out A Top
Major market tops are drawn-out processes that can prove costly, and infuriating, to bulls and bears alike. Younger readers might be surprised to know that was true before Twitter.
Fake-Out Breakout?
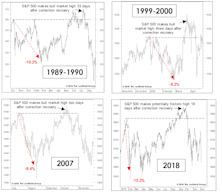
Throughout the recovery from the market’s early-2018 correction, we suggested any new high would be a good candidate for a “fake-out breakout” along the lines of those near the bull market tops of 1990, 2000, and 2007.
Stock Market Observations
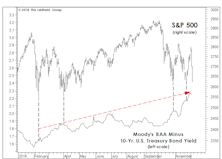
The tops of 1990, 2000, and 2007 were all better “telegraphed” by the action of the market itself, than the September 2018 peak, but secondary measures of market internals suggested all summer that the internal trend was in fact deteriorating—and so did the action in low-grade corporate bonds.
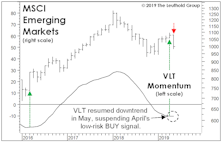
Goldilocks, Meet The Three Bears
.jpg?fit=fillmax&w=222&bg=FFFFFF)
During the stock market’s protracted retracement of its January/February decline, we speculated a few times that the final outcome might look similar to the bull market tops of 1990, 2000, and 2007.
Stock Market Observations
Throughout the spring and summer, the market could alternatively be characterized as “divergent” or “disjointed”—but until very recently it could not be considered “distributive.” Now, Mid and Small Caps have hit a short-term air pocket and breadth figures were exceptionally poor at September’s scattered highs in the DJIA and S&P 500.
Breakout Or Fake-Out?
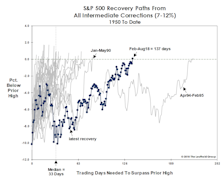
The S&P 500 has fully erased its January and February losses, but there’s probably a market message in the fact that it took so long to do so.
This Is A Head-Scratcher
The longest and probably most complex bull market in history is not going to make a clean and decisive exit.
An ‘87 Market Parallel?
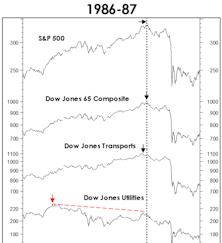
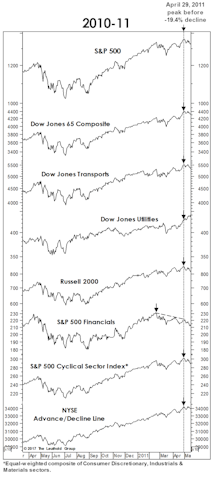
We’ve repeatedly shown how well-telegraphed the bull market highs of 1990, 2000, and 2007 were from the perspective of breadth and leadership. Surprisingly, though, the historic high of August 1987 was not so well-anticipated by the eight market bellwethers to which we’ve lately referred.
Muster Drill: To The Value Lifeboats
.jpg?fit=fillmax&w=222&bg=FFFFFF)
While we’re not calling for an imminent market top, we are keeping a diligent watch from the crow’s nest for signs of a coming market correction.
Strength Begets Strength
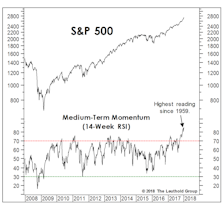
If stock market breadth and leadership look nothing like they typically do at cyclical peaks, neither does momentum.
The Many Faces Of Mo

Momentum is one of the most widely accepted alpha-generating factors, used by quantitative and fundamental managers alike. Its biggest drawback, however, is high turnover. Herein we explore momentum from the perspective of sector weights.
Yet Another Way To Time The Top
Throughout the early and middle innings of the current bull market, we published a variety of “terminal” S&P 500 price targets based on historical bull market norms, various technical retracements/extensions, and miscellaneous valuation objectives.
A Harbor In The Tempest

Our Major Trend Index (MTI) recently fell from “positive” toward stocks to a “neutral” reading, leading us to trim bullish equity positions in our tactical portfolios.
What A Strong “Tape” Does (And Doesn’t) Mean
Our disciplines remain bullish, but we periodically wonder whether we’re being too cavalier in keeping our tactical portfolios “almost” fully-invested (at 65% equities) in the face of valuations that are higher than those seen in all but perhaps 24 months of stock market history.
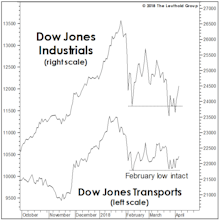
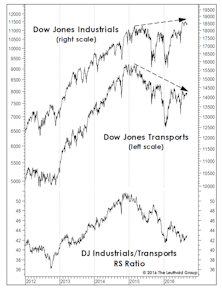
What Are The Transports Telling Us?
The MTI’s subset of Momentum measures entered September at a 6 1/2-year high reading of +1028, with only two of the category’s 40 inputs in bearish territory.
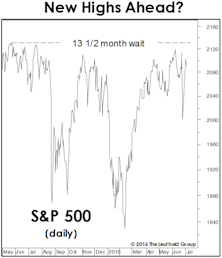
Too Many New Highs To Make A High?
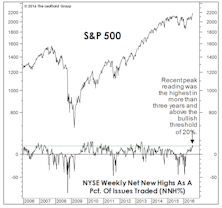
The number of NYSE 52-Week Highs typically peaks during the bull market’s strongest leg, before contracting into the final top. Last month, Net New Highs made a three-year high—implying more upside.
Stock Market Observations
With the S&P 500 levitating near its all-time high, stock market leadership is peculiar—characterized by a flight to quality. And, despite the market’s violent bounce off February lows, there have been only four new market highs set by key indexes on our “Bull Market Top Timeline” table.
“Top In” Or “Topping Out?”
The stock market rally has carried far enough to flip some of our trend-following work bullish, lifting the Major Trend Index to a low-neutral reading. The improvement prompted an increase in asset allocation portfolios’ net equity exposure to 42% (up from 36% previously).
“Transported” To Safety?
Transportation stocks have confounded conventional wisdom about their presumed relationship with oil during the past three years.
All Together Now!
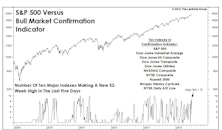
Our Bull Market Confirmation Indicator is tallying a healthy reading. This is intermediate-term bullish, and suggests that a final bull market top should be a minimum of four to six months away.
The Rolling Stock Market Top Of 2013 (… And 2011, 2010, And 2009)
We’ve frequently mentioned the two-faced nature of thematic leadership during the current bull market. Filtering out the minor swings, Phase One lasted from March 2009 through February 2011 and was dominated by low quality, high beta and cyclical stocks.
Perception for the Professional
March 2026 Issue

Featured Articles
Sector Navigator
March 2026 Issue
