Price/Sales
Weigh Those Bags Before Checkout

You’ve likely heard of “shrinkflation,” the practice in which a package of M&M’s is reduced from 40 pieces to 32, while the price per bag is unchanged. Publicly-traded companies have been engaged in similar schemes for awhile.
A Flight Of Wee Dragons
.jpg?fit=fillmax&w=222&bg=FFFFFF)
In our mid-month Of Special Interest, “Valuation Extremes: Here Be Dragons,” we examined valuation outliers as a measure of market sentiment. The hypothesis was that exuberance is reflected in investors’ willingness to hold stocks priced on an aggressive “vision” of the future; companies that are either habitually unprofitable or trade at a Price/Sales ratio above 15x.
Valuation Extremes: Here Be Dragons
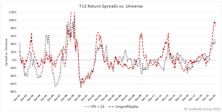
Top decile valuations are often the result of unduly positive investor sentiment that leads to inflated multiples. Bullishness comes in varying strengths: optimism, enthusiasm, exuberance, and, at the extreme, the mania of crowds. Because bullishness manifests itself in aggressive valuations for speculative companies, we believe the prices being applied to such companies - for which intrinsic value is dependent on a future that looks significantly different than today - are an excellent measure of investor sentiment. In that spirit, we examined past cycles of extreme valuations with the goal of understanding how they relate to investor sentiment and what they might tell us about market conditions and relative returns.
Research Preview: A Tale Of Two Tails
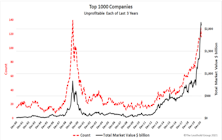
Top decile valuations, such as those in place today, are usually the result of excessively positive investor sentiment that leads to inflated multiples. Bullishness comes in varying strengths: optimism, enthusiasm, exuberance, and, at the extreme, the mania of crowds. Leuthold research typically tracks valuation sentiment by examining median P/E ratios, but in this study, we are taking the opposite tack. Rather than looking at medians, we are focusing on the outliers in each tail of the valuation distribution.
A “Fed” Conundrum
“Don’t fight the Fed” has been great advice for stock market investors over the last nine months. For 2021, that won’t cut it. It should be: “Don’t believe the Fed.”
A Scary Chart, Revisited

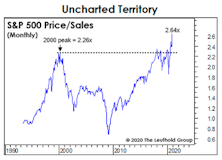
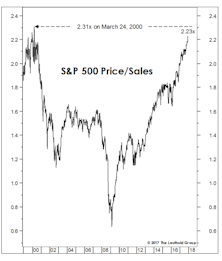
For a couple years, we’ve labeled the S&P 500 Price/Sales ratio as the scariest chart in the Leuthold database, and last year’s decline did little to improve its intimidating appearance.
Market Observations
.jpg?fit=fillmax&w=222&bg=FFFFFF)
It’s been one of the worst years on record for diversification, with our hypothetical All Asset No Authority (AANA) portfolio down 7.2% YTD through yesterday. That’s the second-worst year for AANA since 1972, and there’s probably not enough time left for performance to undercut 2008 (-24.9%) for the bottom spot.
No, It’s Not Y2K Again…But The Lights Could Still Go Out
.jpg?fit=fillmax&w=222&bg=FFFFFF)
For the last year, we have labeled the S&P 500 Price/Sales ratio—which has returned to its Y2K bubble levels—the “scariest chart in our database” (Chart 1). Recall that the initial visit to present levels was followed by the S&P 500’s first-ever negative total return decade.
Multiple Contraction—Just A Little Patience?
Things were bigger when you were a kid. Like that enormous sweatshirt your aunt gave you for your birthday or that hand-me-down ten-speed bike with the cross bar taller than your shoulders.
Estimating The Upside?

The remarkable stock market breadth and momentum chronicled in these pages doesn’t come without a price.
Kicking Off The Year... With A Good Year

During the first four trading days of 2018, the S&P 500 managed to match its 93-year average annual real price gain of +2.6%.
Value: Scarcer Than In 2000
Comparing current valuations to March 2000 is unfair to March 2000. Any Value or Small Cap manager from that era can attest that values became more plentiful as the S&P ascended into its narrow peak.
Stock Market Observations

Economic and momentum considerations have kept us mostly aboard this bull for much longer than our value-seeking inner selves would have otherwise allowed.
Revisiting The Y2K Highs
Bobby Knight thought coaching would be perfect “if it weren’t for those damned games.”
Long On Equities, Light On Conviction

In the wake of the tech wreck and the housing bust, usage of the term bubble by the media and market pundits has become increasingly liberal.
To Play The Rally, Or Not To Play?
Question: What will you do if the Major Trend Index returns to its bullish zone?
Running The Math On Mega Caps
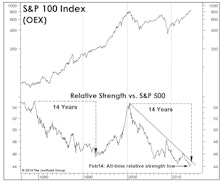
The recent move by the S&P 100 Index (OEX) above its historic March 2000 high prompted us to take a closer look at the turnaround potential of this perennially underperforming Mega Cap index. Remember, a Large Cap leadership cycle has been in force since April 2011—with the trend strengthening the last few months. What are the prospects for the biggest of the Big Caps?
Estimating The Downside - March 2014
BACK TO THE MEDIANS (1957 To Date): S&P 500 13% Downside
The S&P 500 gained 4.3% (price only) in February. Based on the 1957-to-date valuation metrics presented below, the S&P 500 has 13% downside to its historical average. The S&P Industrials (which excludes Utilities and Financials) now has 26% downside to reach mean valuation.
2013 Factor Performance Review

2013 ended up being a good year for quantitative strategies, particularly those that focus on using Momentum
Health Care's Top 20 Stocks

Highlight on the Health Care sector: Relative Valuations, Top Twenty Components, P/E Ratios, PSR, and Gross Profit Margins.
Checking In On The Tech Top 20–Valuations Remain Reasonable

The twenty biggest Tech stocks were flat in April, but remain up 7% YTD on a median basis.
Tech Watch Revisited – Examining The Bullish Case For Info Tech

Technology continues to be a hot topic. This month’s “Inside The Stock Market” takes an objective look at the Tech sector.
Growth Stocks: Where The Value Is

Large Cap Growth stocks are now cheap relative to Large Cap Value. Value segment still leads over Growth among the Small Caps and among the Mid Caps.
Sector Spotlight...on Technology
Looking for Q4 tactical trading opportunities in Tech.
Price To Sales Ratios....Are Small Caps Still Significantly Cheaper?

On a price to sales basis, small caps sold at 43% discount to large caps at the end of 1999, but this has virtually disappeared in the past four years of strong small cap performance.
Tech Watch

This may be one of the few sectors that has the opportunity to provide 20% or more growth in 2003. If investors can get over their fears, they could be rewarded by the Tech sector.
Trying To Rationalize Today’s Stock Market Valuations

Bullish conclusions using today’s low inflation levels and today’s “low” bond yields are derived from very short-term, historical time horizons. Longer term studies do not support these conclusions.
High Tech…No Wreck Yet

Fat profit margins are stimulating competition and capacity which will ultimately bring margins (and tech stocks) down. Technology fragmenting, but the end is not quite yet in sight.
Comparing Technology Manias (Updated)

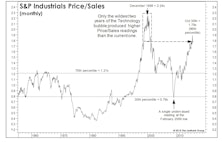
“Tech” manias revisited: comparing P/E ratios and Price/Sales ratios.
Perception for the Professional
March 2026 Issue

Featured Articles
Sector Navigator
March 2026 Issue
