Sales
Unraveling Q1’s Twists
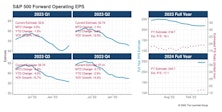
Earnings Almanac is a new research product where we dive into quarterly reporting for the S&P 500. The report is released the first week of the last two months of the calendar quarter.
Valuing The Experiential Reopening
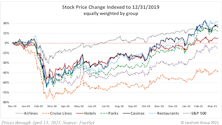
The onset of the COVID-19 pandemic in early 2020 brought a sudden halt to social gatherings, crowd events, and even personal contacts. Experiential business models were hardest hit by forced closures and lockdowns; cruise ships were forbidden to sail, restaurants and theme parks were closed, and air travel and hotel occupancy dwindled, all in an attempt to minimize personal interactions. The stocks of leisure services companies took a beating in March 2020, with Chart 1 documenting the virus’ impact on 34 large and midcap stocks representing this theme.
Research Preview: The Experiential-Reopening Trade
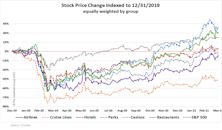
A strong argument can be made that experiential consumer services was the economic sector hardest hit by the pandemic lockdown. Cruise ships were forbidden to sail, restaurants and theme parks were closed, and air travel and hotel occupancy dwindled—all in an attempt to minimize personal/public interaction. The stocks of experiential companies took a beating in March 2020.
Emerging Markets: Fundamental Diffusion Indicators

Within EM, more robust growth is being exhibited by: 1) firms in Emerging Europe; 2) companies in Energy, Materials, and Financials; and, 3) larger cap companies.
Can Companies Sustain Cash Payouts?

Companies are returning cash to investors at a level never before seen. Counting dividend payouts and outstanding share repurchases, the amount of cash returned back to investors crossed the $1 trillion mark for the first time in January 2016 (based on trailing twelve-months’ total for the largest 500 companies, Chart 1).
Earnings Momentum

Up/Down Earnings: Two Month Reading Slumps To Average
Earnings Momentum

Up/Down Earnings ratio cools off in August.
Earnings Momentum

Up/Down Earnings: Q2 Starts Off With A Bang
Separating Earnings And Sales Growth

With the two factors decoupling, we examine if either one has been adding more value.
Earnings Momentum

Easy earnings growth days are behind us.
Earnings Momentum

Up/Down Earnings: Q4 Results Just Below Historical Average. Median Q4 YOY Revenue Comparisons: Strength In Large Caps. Q4 Median Company Earnings Growth: Initial Results Are Impressive
Earnings Momentum

Up/Down Earnings: Q3 Ends Below Average. Median Q3 YOY Revenue Comparisons: Small And Mid Caps Continue Leading. Q3 Median Company Earnings Growth: Mid Caps Continue Leading
Earning Momentum
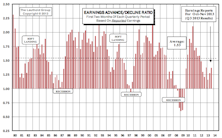
While the current ratio of 1.37 is relatively weak historically, it is still an improvement from the second months’ readings of Q2 (1.27) and Q1 (1.16).
Earnings Momentum - Q2 Reports Below Average But Ahead Of Q1

With all three months of Q2 earnings reports in, the 1.28 ratio is much stronger than Q1, but remains below the 1.51 historical average ratio.
Q2 Median Company Earnings Growth Rates Vary Drastically Across Cap Size
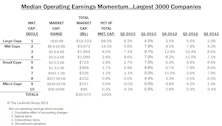
EPS growth for Large and Mid Cap companies continues exceeding their top-line growth, but Small and Micro Cap companies saw their EPS growth rates coming in below their top-line growth rates.
Q2 Median Revenue Comparisons: Higher Growth Across All Segments
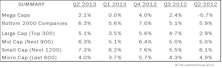
Large Cap result this month is the same as last month, but remains stronger than Q1. Smaller firms reversed course, as Mid, Small, and Micro Caps all rebounded with large sales momentum increases.
Key Observations On Q2 S&P 1500 Earnings
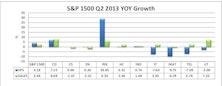
Year-over-year EPS growth rate for companies with Q2 reports (with about 65% in) currently stands at +4.2%, while revenue growth has come in at a better than expected +2.6%.
Q2 Median Company Earnings: Growth Rates Volatile But Positive In General
EPS growth rates are coming in higher than expected. While sales growth remains muted, the ability of companies to do more with less and maintain high operating margins is impressive. Margins are determined at the discretion of management and are thus sticky and unlikely to drop off significantly unless wage pressures resume and slack capacity around the globe is absorbed.
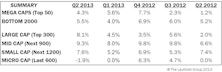
Q2 Median Revenue Comparisons: Higher Growth In Large And Mid Caps
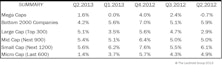
Q2 relative to Q1 growth rates have improved for larger cap companies but deteriorated for the smaller firms.
Global Perspective On 2012 Earnings, Sales, and Margins
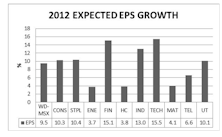
Leuthold’s Eric Weigel dissects earnings, sales and margin expectations for the coming year.
Analyzing Large Cap, Mid Cap & Small Cap 2004 Composite Income Statements

2004 earnings very strong but further earnings improvements in 2005 will be largely a function of stronger sales, not any more margin expansions.
Better Top Line Growth Points Toward Improved Bottom Line

Earnings momentum may appear to be slowing, but it is last year’s comparisons that were overstating the results.
Eye On The Consumer

Important pillars of economic bridge until Capex kicks in and business confidence improves. Interest only mortgages-the ticking time bomb debt. U.S. Consumer debt OK compared with other countries but, what happens when interest rates rise?
Unreal Expectations, Unreal Money = Lingering Pain
By Kate Welling - Companies are still acting, by and large, as if they have an inalienable right to spin numbers in whatever direction produces the most pleasing results.
Index Sector Weights and Comparisons With Sales and Earnings

New series compares index industry sector weights with sales and earnings contributions.
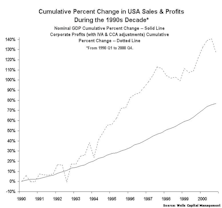
S&P 500 Sales and Earnings Trends

Our momentum studies indicate that big cap earnings and sales momentum may be fading. Small cap earnings and sales trends, on the other hand, appear to be stable and maybe even improving.
Perception for the Professional
March 2026 Issue

Featured Articles
Sector Navigator
March 2026 Issue
