Seasonality
Delayed Reckoning?
The month of October gets all the “love,” but since 1990, August has been the cruelest month for stocks. We point this out because calendar patterns lately seem to explain this market better than just about anything else. In 2022, big losses in stocks and bonds arrived right on schedule—during a time of Jewish sabbatical (the Shmita Year).
Factor Tilt Update—June 2023
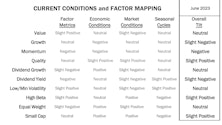
This Leuthold Refresh updates our Factor Tilt analysis, an ongoing process to evaluate the attractiveness of commonly accepted investment styles. Factors are investment characteristics that have historically produced excess risk-adjusted returns, but relative results fluctuate over time.
Times Are Still Tough For “Timing”
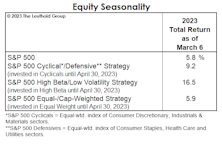
YTD, passive strategies are again ahead of most attempts at timing, though we still believe that asset allocation success over the next several years will require much more use of the latter.
Irrationality Is Back, Right On Schedule
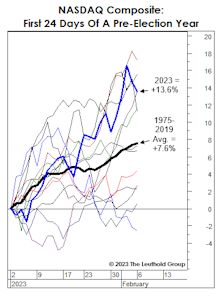
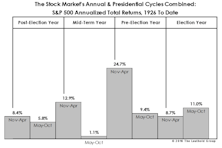
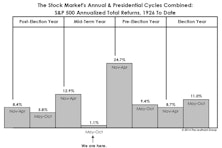
The hostile monetary backdrop makes recent stock market exuberance even more irrational than in early 2021. Yet, this is the middle of a seasonal window that historically boasts an elevated level of craziness: It is the year preceding a presidential election—a time when monetary and fiscal stimulus are ramped up.
“The Streak” Is In Jeopardy…
With less than a month to go, our hypothetical All Asset, No Authority (AANA) Portfolio seems likely to beat the S&P 500 on an annual basis for the first time since 2011. However, it’s doubtful that many real-world, institutional multi-asset portfolios were as heavily exposed as AANA to the best-performing assets—commodities and gold.
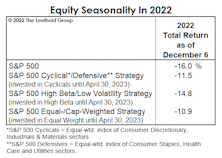
Seasonal Nightmare Ending?

We’ve reminded dejected readers throughout 2022 that this year was statistically “cursed” from the onset. It’s a year ending in “2” and a Shmita year on the Jewish calendar, both of which have been associated with far below average stock market returns. More importantly, it’s a midterm election year, traditionally the weakest of the four-year cycle.
Can Santa Cap-Off A Stellar Year?
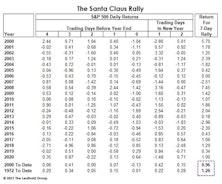
The S&P 500 is flirting with new all-time highs, and the news gets even better for followers of seasonal patterns: The Santa Claus rally has yet to officially begin!
Seasonality Of A Different Sort
In the June 2018 Green Book, we noted that stocks have shown a fairly reliable correlation with a calendar of an entirely different sort: the solunar calendar. It turns out that the days that our $9.95 “iSolunar” iPhone app predicts to be good ones for fishing (based entirely on phases of the moon) are the same days that stocks have enjoyed the largest average gains!
It’s That Time Of Year…
October’s nearly +7% S&P 500 surge was impressive, but came a month early—according to the traditional seasonal cycle—which turned bullish on November 1st, and will remain intact for the next six months.
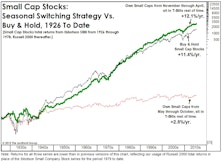
A Small Cap Strategy Session
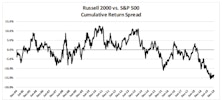
Leuthold’s research team has recently flagged a number of items that suggest it may be time to consider small cap stocks. This asset class has been showing signs of life and the decision to overweight small caps is starting to seem relevant – and perhaps nicely profitable - again.
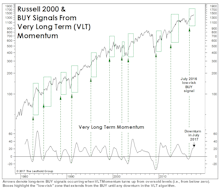
VLT Complicates The Market Puzzle

At October’s close, a long-term BUY signal was triggered on the Russell 2000. The fact that some market segments are triggering “oversold BUYS” when blue chips are at record highs speaks volumes about the internal disparities that have developed during the last few years. The Russell BUY signal is not inconsistent with our belief that the action since the January 2018 peak remains part of a lengthy cyclical topping process.
Sell *Beta* In May
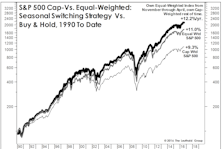
The six-month stretch beginning in May generally coincides with a narrow stock market in which non-cyclical and low volatility stocks tend to be the winners. Hence, don’t “sell” in May, but rather, tilt away from beta and away from “breadth.” These seasonal switching strategies have 70% batting averages.
Bull Pause, Or Bear Paws?
The old maxim says that when the bears have Thanksgiving, the bulls have Christmas.
Have We Already Had The Year-End Rally?
.jpg?fit=fillmax&w=222&bg=FFFFFF)
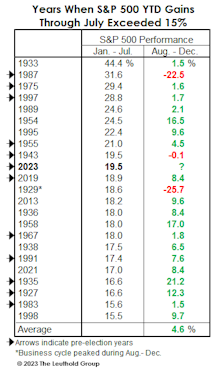
In the March Green Book, we discussed the long history of stock market difficulties during mid-term election years. Incredibly, nine of the past 11 cyclical bear market lows have occurred in these years, with eight of those nine recorded during the seasonally-weak months of May through October (Table 1).
Seasonality Set To Favor The Bulls
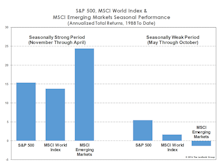
Our bearish stance could be tested by the arrival of the seasonally strongest six-month window of the four-year electoral cycle. Since 1926, November of the mid-term year through April of the pre-election year has produced an average un-annualized S&P 500 +16.4% total return.
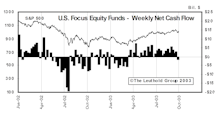
Stock Market Defies Seasonal Gravity
.jpg?fit=fillmax&w=222&bg=FFFFFF)
“That which does not kill us, makes us stronger” might be a good motto for this never-ending bull market. The bull continues to shrug off the effects of both Quantitative Tightening and an escalating trade war, and it’s doing so during a seasonal stretch in which many of its predecessors have sunk to their knees (if not their demise).
Seasonality And Market Breadth
While the FANGs—and, lately, the Dow stocks—are the market’s undisputed leaders, it’s difficult to argue the market has narrowed in a fashion that’s indicative of a “distribution” phase.
VLT Goes “Quiet”
Last year’s “low-risk” BUY signals from our Very Long Term (VLT) Momentum algorithm have proven very profitable, but enough time has elapsed that they should no longer be considered an important bullish factor.
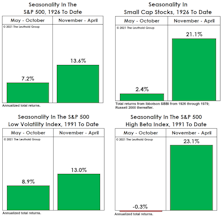
Small Cap Seasonality
We’ve seen several pundits’ analyses of the “Sell In May” phenomenon of late, but none of them has addressed the most salient feature of this anomaly, which is that it’s historically been a predominantly Small Cap phenomenon.
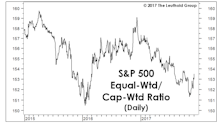
How To Beat The S&P 500 With The S&P 500
While 2016 is shaping up to be one of the most difficult years ever (on a relative basis) for active equity managers, one cannot blame the usual culprit of “narrow” market participation.
EM: The Case For Waiting...
We’ve mentioned that concerns over potential seasonal weakness in September and October seem pronounced this year, perhaps because the year has so far turned out a pleasant surprise following its horrendous start.
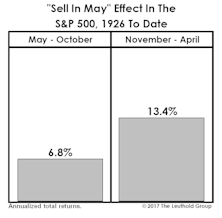
Sell In May: Statistical Update
If this year’s interest in the “Sell In May” phenomenon is any indication, there remains plenty of skepticism surrounding the market’s recent rebound. The good news is that the “Sell In May” play has been weakest during presidential election years.
Year-End Rebound?
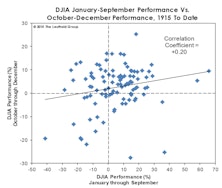
We reviewed 100 years of evidence for the Dow Jones Industrials Average and found no compelling evidence for a “bounce” effect. Contrary to expectations, fourth quarter Dow performance has (on average) been stronger when the index has already booked a gain through the first nine months.
It’s That Time Of The Year
Seasonality rests one rung above witchcraft in the pecking order of respected analytical techniques, yet our studies haven’t been able to refute its validity. We simply don’t understand why calendar phenomena that have persisted for decades should still be around.
A Game Of ‘What If?’
Considering the Major Trend improvement, new bull market highs (Nov. 6th) on the S&P 500, DJIA, and DJ Transports, we present a list of talking points we’d use if forced to make a bullish stock market case.
The Worst Of The “Window” Is Upon Us
Three months ago, our “Of Special Interest” section reviewed the historically pronounced effect of the well-known “Sell In May” phenomenon during mid-term years of the presidential election cycle.
A Quick Take On Time Cycles

We stop short of embracing any sort of fixed stock market time cycle, but it's statistically difficult to discredit certain calendar patterns.
Sell in May
This does not only apply to stocks, it applies to just about all risky assets.
Market Internals: The Good And The Bad
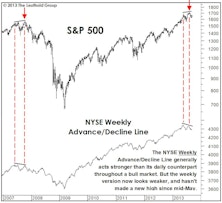
Leadership isn’t warning of impending weakness in either the U.S. economy or the stock market. Market breadth, on the other hand, is highlighting risks that aren’t evident when inspecting leadership alone.
What To Sell, If Selling In May

Those inclined to sell in May should sell Small Caps. If you don’t have Small Caps, sell Cyclicals, at least for the next six months.
Sell In May: Reformulated For The Fully-Invested
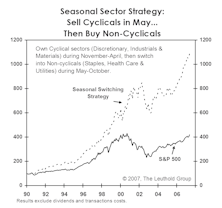
While the “Sell in May” market phenomenon has become part of Wall Street lore, the sector implications of this seasonal pattern are less well-known.
February 1st: Investors' Groundhog Day
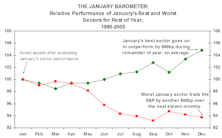
We wondered whether or not strong relative sector price action during January tended to persist for the remaining eleven months of the year. During the last 16 years, evidence proves that the strength does persist.
Is January Performance Predictive?
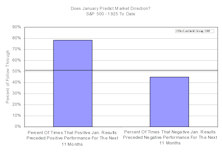
A look at the January barometer, indicates there is not much evidence that a weak January market portends weak performance in the remainder of the year.
January Effect: Now Tends To Arrive In December
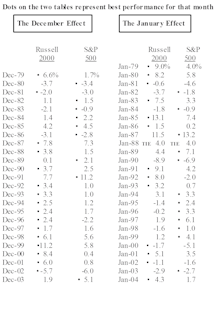
The January effect still lives…..it just comes a month earlier in December.
Into The Home Stretch…..2003
Octophobia 2003…..The stock market has nothing to fear but fear itself. The financial system is awash in liquidity, the economy stronger than anticipated and investor confidence is returning.
The Year That Was

Remain bullish on the stock market, but don’t expect Main Street to be a major stock market factor in 2003. Today’s bull market expectations for the DJIA, S&P, and NASDAQ.
A Disappointing Start
The “seasonals” were with us, but have yet to produce positive results. “V” shaped economic recovery conviction stronger than a month ago.
....The Year That Was

Looking Back: The best thing about 2001 is that it is over. Looking Forward: The seasons are with us as January is statistically the strongest month of the year.
April Is The "Opportunity" Month

Bear market broadened out in late March to include other than technology sectors. Never before have so many lost so much.…There is plenty of blame to go around. Academia, The Street, the Media, the “Experts” to name a few.
Big Caps Hot Out Of The Starting Blocks
It’s no secret that the term “January Effect” has taken on a different meaning in recent years. Once a reference to the price bounce that underperforming small caps stocks receive as year end selling pressures dissipate, it has now been adopted by commentators to describe the unconstrained rally of large cap stocks, as the seasonal flood of cash pouring into big cap growth funds is invested
Perception for the Professional
March 2026 Issue

Featured Articles
Sector Navigator
March 2026 Issue
