Small Cap
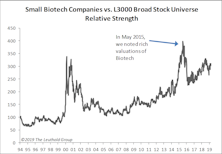
Small Cap Biotech Getting Pricey Again
In May 2015, we warned about rich valuations for small cap Biotech stocks and looked at various ways to evaluate those companies, as the majority have no approved drugs on the market, thus no revenue; therefore, valuing these companies using the conventional methodology is problematic.
Stock Market Defies Seasonal Gravity
“That which does not kill us, makes us stronger” might be a good motto for this never-ending bull market. The bull continues to shrug off the effects of both Quantitative Tightening and an escalating trade war, and it’s doing so during a seasonal stretch in which many of its predecessors have sunk to their knees (if not their demise).
Rates Are Up, But Are They High Enough To Punish?
While momentum has been the best-performing stock selection factor in 2018, there’s a less well-known and purely fundamental factor that rates almost as well: A company’s ability to lose money!
Small Cap Valuation Check
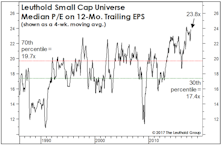
We don’t have a strong capitalization-bet recommendation, other than to remind readers that Small Caps have been especially responsive to the favorable seasonal window that began November 1st (and which extends through April 30th).
Small Caps Surrender Their "Trump Bump"...Now What?
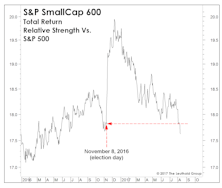
With this week’s losses, Small Caps have relinquished all of the massive outperformance they enjoyed in the month following the presidential election.
Active Vs. Passive Return Drivers
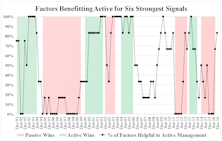
Our July special report “Active vs. Passive: A Three-Club Headwind” studied the recent dominance of passive indexes over actively managed funds.
Small Cap vs Mid Cap vs Large Cap
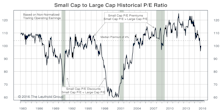
The Ratio of Ratios bounced off last month’s multi-year low (4% Small Cap discount) but still sits firmly below its Small Cap median, which is a premium of 4%.
Small / Mid / Large Cap
The August market action deflated P/E ratios across all market cap tiers, but our ratio of ratios was little changed.
Small Cap/Mid Cap/Large Cap
Nudged higher by Small Cap outperformance in May, our premium is little changed month-over-month and remains in its new 5-10% habitat.
Small Cap/Mid Cap/Large Cap
Small Cap Premium Plunges To 5%
Small Cap vs Large Cap
Small Cap Premium A Tick Higher To 16%
Small/Mid/Large Cap
Small Cap Premium Sinks To 15%
Small Cap vs Mid Cap vs Large Cap
Small Cap Premium Spikes Back To 20%
Small/Mid/Large Cap - Small Caps Experience Worst Monthly Return Since May 2012
In September, the Russell 2000 index lost 6% and is down 4.4% YTD. Large Caps widened their YTD performance lead (S&P 500 +8.3%). Small Cap Premium slides to 15%.
Small Cap/Mid Cap/Large Cap
Small Caps are selling at a 19% valuation premium relative to Large Caps.
Small/Mid/Large Cap
Small Cap Premium Slumps To 17%
Why Are EM Small Caps & Frontier Markets Outperforming?
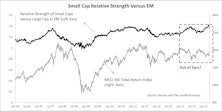
Emerging Market investors are extending their “small” bet down to Small Caps and the Frontier Markets. We discuss potential reasons behind their outperformance.
A Milestone You Might Have Missed
The fifth anniversary of the bull market was met with fanfare, but the launch of the Large Cap leadership cycle in April 2011 is receiving no attention whatsoever.
Stock Market Leadership In 2014: Large Caps, Tech, Health Care
Following a great year for trend-following, capitalizing on key reversals in sector performance will be important in winning the 2014 performance derby.
Small Cap Cycle Extension?
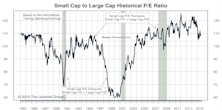
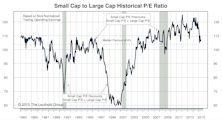
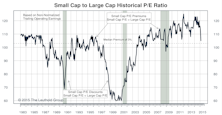
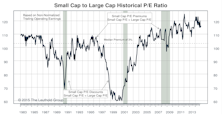
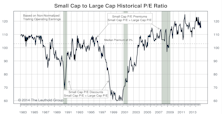
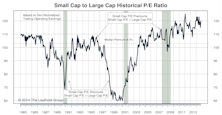
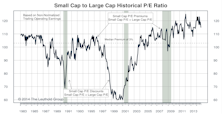
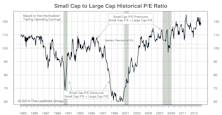
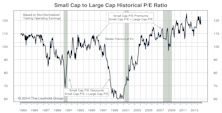
Small Caps have an historically high P/E premium of 15% vs. Large Caps. This premium could go higher, but we’d be reckless to call for a long-term extension of Small Cap leadership given this premium.
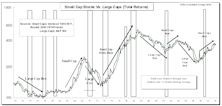
Large Cap Vs. Small Cap: Performance Parity 1979 To Date
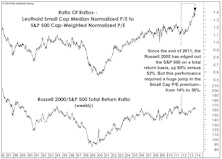
If we look only at the past eleven years, 2000-2010, the S&P 500 has decisively underperformed the Russell 2000.
Good News Is Here… Now What?
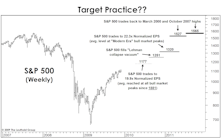
Climbing the bull market stairs. Our initial upside price target for the S&P 500 is 1300 to 1350. This is based on normalized P/E ratios moving to prior bull market average peak levels, as well as on past market peaks.
Can Growth Stocks Outperform Value In A Bear Market? You ‘BETA’ Believe It!
Conventional wisdom and modern day historical evidence indicate that Value stocks do better in bear markets. But from the 1920s through the 1970s, it was Growth that held up best during bear market declines.
Sector Level Earnings Outlook – More Pain To Come In Analyst Revisions?
NIPA earnings (National Income and Product Accounts) were revised downward significantly. Also believe that Small Cap earnings estimates are overly optimistic.
Introducing Leuthold's Small Cap Groups & Group Selection (GS) Scores
Beginning this month, we’ll be distributing a new research publication: Leuthold’s Small Cap Groups. The core of this new publication will be a 15 factor, small cap group selection model based on our time tested, and highly successful, Group Selection (GS) methodology (with a few twists).
Leuthold Ten Factor Small Cap Leadership Model Update: Still Neutral
Market seems to be moving toward a possible leadership transition from small/mid caps to large caps. Small caps significantly lagged large caps in July, and also now lag YTD.
Comparing Small Cap Performance Measures
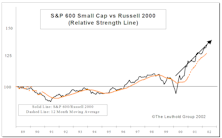
Small Cap indices performance divergence. Why has the S&P 600 significantly outperformed the Russell 2000 the past two years?
New Select Industries Group Holding: Small Cap Value
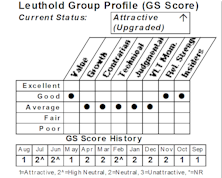
Is “Value” back? Not certain yet, but our thematic Small Cap Value group was upgraded to Attractive this month due to big jump in GS Score.
View From The North Country
Many consultants and their clients have tightened the style boxes and narrowed the definitions to such a degree that it hamstrings the manager….and it’s detrimental to the client’s long term results.
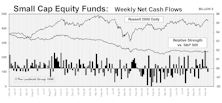
November Mutual Fund Flows
U. S. focus equity fund inflows are estimated to have risen to $20 billion in November. Also, we highlight a few of the more significant seasonal effects and point out things to look out for in the coming weeks.
Big Cap Versus Small Cap: S&P 500 Versus Russell 2000
The following table compares the performance of the Russell 2000 Index (since its inception in 1979) with the S&P S00. Over this entire period, the Russell has outperformed the S&P in ten of the twenty years (S0% of the time), producing a slightly lower annual compound rate, 12.4%, versus 13.6% for the S&P 500.
What Seven Year Cycle?
While we currently believe small cap and secondary stocks will be superior performers in the foreseeable future, we have no idea how long this phase might last. Don't pay any attention to this seven year cycle hogwash.
December Bottom Fishing Update
In early December, we sent all clients a list of trading stocks to buy in December and sell in January.
.jpg?fit=fillmax&w=222&bg=FFFFFF)
.jpg?fit=fillmax&w=222&bg=FFFFFF)
