Unemployment
Labor Market Begins To Labor...
Most labor market measures continue to weaken, and for investors still heavily invested in stocks, we’d caution against waiting for all labor market figures to deteriorate before scaling back. Equities will likely take a big dive before such conclusive evidence arrives.
Waking From A Slumber?
We’re very skeptical that the rally from last October’s low represents the first leg of new bull market. But if it is—as many believe—then it has unquestionably inherited the worst set of genes we’ve ever observed in the species.
CBO: The Ministry Of Misinformation?
After failing to publish an estimate for the GDP Output Gap for nine months, the Congressional Budget Office has just decreed that the economy has yet to reach its full-employment potential!
Labor: Snatching Defeat From The Jaws Of Victory
This year it’s been popular to say the Fed will hike interest rates until it “breaks something.” Has that not already happened? Pull up charts of the Japanese yen, the British pound, and the euro, among others. And stateside, the Fed has broken one of economists’ favorite toys: the Phillips Curve.
Labor Is The Limiting Factor
If the economy slips into recession, the Fed will get all the blame. But it’s worth taking a step back to consider that the die has already been cast: The “capacity” for the U.S. economy to grow is nearly exhausted. Specifically, we’re referring to the capacity available in the labor market.
When There’s No Slack, It’s A Bad Time To Slack Off
The scene in our neighborhood in the last two summers has become one of relaxed and well-tanned professionals out in their yards overseeing home improvement and landscaping projects. No surprise: Not a single one has told us they’re less productive when working from home!
Looking “Bustier?”
Key indicators are indeed trending in “pre-recessionary” fashion. Among them is the ISM New Orders Index, which dipped into contraction territory in June while inventories increased. Others are the JOLTS that shows a strong (but weakening) labor market, and unemployment claims—which have ticked up.
Consumers’ Misery Is Also The Fed’s
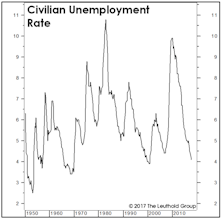
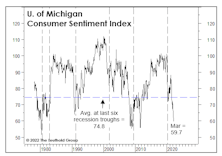
An already-low unemployment rate has dropped another 0.3% YTD (to 3.6%) and stocks’ rebound in the second half of March took the S&P 500 to within 3.5% of its all-time high. Yet Consumer Sentiment has sunk to 59.7—a reading that’s 15 points below the average seen at the last six NBER business-cycle troughs. Why the long faces?
The Bull Visits The Vet
Just after yesterday’s close, we loaded our precocious bull into an SUV and drove to the local veterinary clinic for a two-year checkup.
Our bovine buddy drew some sympathetic stares while we were waiting in the lobby. Noting our bull’s droopy eyelids and gray facial hair, an assistant informed us, “You know, you didn’t actually need to bring him here. We now have a mobile euthanasia service.” We just smiled, and waited for the veterinarian, who is said to be a specialist in this new super-species of bull.
Special Study: Should You Buy The Dip? Some Statistical Considerations…
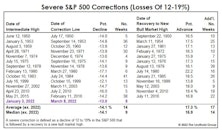
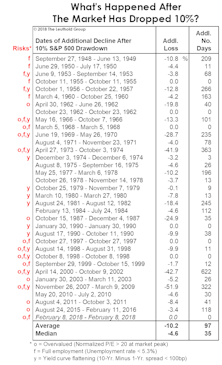
The correction in the S&P 500 since its high on January 3rd qualifies as a “severe” correction, which we define as a decline of at least -12% based on daily closing prices. What are the odds that it becomes a “major” decline*—in which the loss exceeds -19%?
In Section I, we review the history of severe corrections since 1950. In Section II, those corrections are analyzed in the context of the economic cycle, consumer sentiment, and other underlying factors—ones that might help us determine if today’s stock-market weakness is “buyable.”
Too Early To Buy?
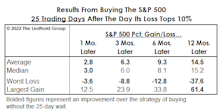
Many investors will instinctively salivate at lower prices, whether or not they represent good value. Is there a better way to temper this Pavlovian impulse and improve results? We found it’s better to wait 25 days before re-entering the market after a 10%-correction threshold is breached.
Is Powell A “Phillips Curve” Guy?
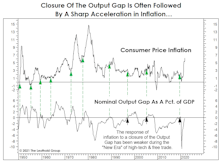
With consumer price inflation raging at 6.2% and few indications of an imminent rollover, Jay Powell has waved the white flag and retired the ill-begotten “transitory” descriptor. The timing of Powell’s concession is intriguing—perhaps he’s a fellow follower of a simple inflation model: the Output Gap.
The Inflation Surge In Context
Inflation is already “too high” for the current cyclical setting, and the level of inflation that equity investors are willing to tolerate will drop further as the economy recovers.
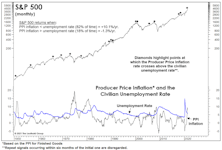
How Much Inflation Is Too Much? It’s A Moving Target
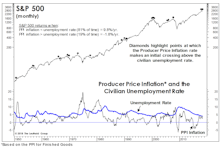
In the latest Green Book, we noted that Producer Price Inflation does not usually become a challenge for the stock market until its annual rate breaks above 4.0%. The day that comment was published, the year-over-year gain in the March PPI for Finished Goods spiked to 6.0%, thanks mostly to the well-celebrated COVID-19 anniversary-effect.
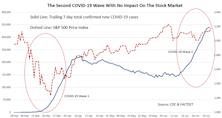
The Second Wave: No One Seems To Care!
While investors cheer the stock market on to challenge its all-time high, new COVID-19 cases are also making daily records in the U.S. The first wave of the pandemic helped to tank the S&P 500 by nearly 30% in the course of three weeks, while the second wave, now in development, has yet to deter the raging bulls.
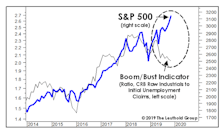
A Long Boom, And The Ultimate Bust
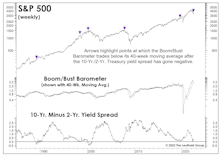
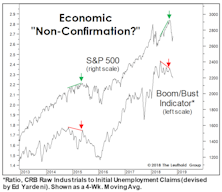
Last December, we marveled at the disconnect between the (surging) S&P 500 and the (sagging) Boom/Bust Indicator. Just six months later, we can only scratch our heads at what the hell we were complaining about.
Labor Cost Observations
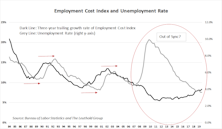
We take a look at different data sets reflecting labor costs. The main finding is that using Unit Labor Cost as the measurement for the true cost suggests that the labor market is very tight in terms of affordability for businesses.
Slowdown Or Recession? Confidence Is Key
The pattern of sharp sell-offs followed by equally sharp rallies continued in June. Most risky assets recouped nearly all the losses suffered in May, and then some.
Bust To Boom, And Back Again
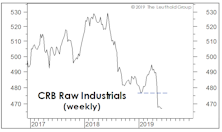
Last month, we observed that crude oil was the only item propping up broad-based commodity indexes, and that something was bound to give with the U.S. dollar pushing to new highs.
Unemployment And The Point Of No Return
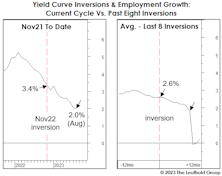
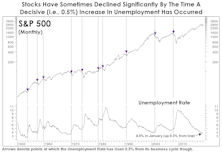
We’ve done extensive work on the yield curve, but until now had entirely overlooked an employment-based recession indicator that’s lately come into focus.
Assessing The Cyclical Risks
With all the excitement over the Fed’s shift in rhetoric and the excellent subsequent market action, there’s a danger of losing sight of the broader cyclical backdrop for U.S. stocks. Remember, the economy is still operating beyond government estimates of its full-employment potential, and it’s not as if the Fed has actually eased policy—as it did successfully at a similar late-cycle juncture in the fall of 1998 and (ultimately unsuccessfully) in the summer of 2007.
Too Soon To Expect Economic Weakness?
We believe stocks have begun to discount a major inflection point in the economy and corporate profits for 2019 and 2020.
Assessing The Correction
How do today’s cyclical conditions stack up with those accompanying other stock market declines?
Inflation Warning Flags?
After yet another benign figure on wages for June, the idea that inflationary pressures might be a problem for the stock market seems far-fetched.
Full Employment And Rising Prices Aren’t Stock-Friendly
Annual Producer Price Inflation rose to 4.0% in May, a key threshold above which the S&P 500 has historically delivered essentially flat returns. But the fact that this reading occurs against a backdrop of full employment is cause for even more concern. Context is key...
The Gap Is Back!
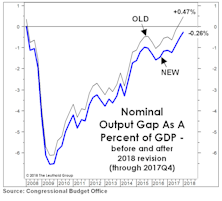
We celebrated the official closure of the GDP Output Gap in December, but that milestone was revised away in April by the statisticians at the CBO through a downward adjustment to the estimated rate of “full employment.”
The “Gap” Is Gone. Now What?
In Q3, the CBO’s Nominal Output Gap swung to positive for the first time since the last business cycle peak. This type of move has historically meant the cyclical peak in profit margins is close at hand.
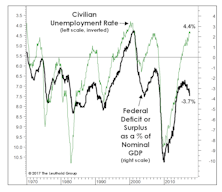
Tax Reform Or Not, The Budget Is Already Busted
In 2010 and 2011, we were sometimes chastised for not paying more attention to exploding federal deficits, which at the time were running between 8% to 10% of GDP. We argued that a substantial share of these budget shortfalls was cyclical in nature, and would eventually be reversed by an improving economy.
Two Curves, One Theme
Our data shows the traditional Phillips Curve relationship between the unemployment rate and wage inflation still holds.
Don’t Look Now, But...
We recognize it’s uncultured to discuss federal debt and deficits during a multi-year bull market, but in economics and investing it frequently pays to worry when others don’t, and to stop worrying when others do.
A New Take On The Labor Market
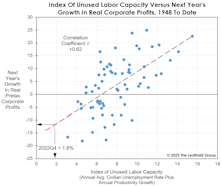
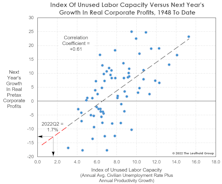
Politicians bemoan the lack of “good-paying jobs,” but what’s the current perspective of employers? According to a simple measure developed by economist Edward Renshaw many decades ago, employers see a lack of “unused labor capacity” in the U.S. that should lead to yet another year of disappointing GDP growth in 2017.
How Much Slack?
By now it’s consensus that the Fed missed the ideal window for the first rate hike (if one ever existed) by at least a year and a half. We don’t disagree…
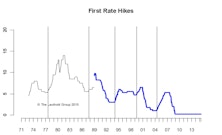
Navigating The First Rate Hike
Our current view is the lift-off will be December or later. Assuming inflation will pick up and the Fed hikes the rate by the end of 2015, stocks will perform relatively well, with international stocks a better bet than U.S. stocks.
The Economy In 2014: Solid But Unspectacular
This year should be a solid but unspectacular one for the U.S. economy, with real GDP growth of about +2.5%. We expect the Consumer Price Index to rise just 1.5%. Unemployment should continue to fall.
Global Yield Curve Confirms “Muddle Through” View
The global yield curve is in a sideways range bound pattern, indicating anemic demand for credit. An examination of developed and emerging countries confirms our “muddle through” view.
“Just Another” Soft Patch
MTI studies of market values, investor psychology and price action have (so far) overwhelmed the economic “elephants in the room.” A few thoughts on those elephants.
Deciphering The Real Message In The Employment Figures
It’s a big mistake to react to the headline reports of employment, and an even bigger mistake to make investment decisions based on them.
Update On Non-Farm Payrolls....Buy Signal Likely With November Data
Non-farm payroll data is poised to register a buy signal for the stock market in early December. Using the year over year rate of change has historically been very effective in identifying recession-related market bottoms.
Employment Data Continues To Deteriorate
At the risk of beating the “we’re in a recession” theme into the ground, we thought some analysis of the hot-off-the-presses March employment data would be worthwhile.
Jobs/Consumer Data Flashing Recessionary Signals
Optimists have continuously cited low unemployment and the ever resilient U.S. consumer as two “pillars of strength” that will help keep the economy afloat. It has become considerably more difficult to make this case in recent months, as jobs and spending data have weakened to levels associated with recessions.
.jpg?fit=fillmax&w=222&bg=FFFFFF)
.jpg?fit=fillmax&w=222&bg=FFFFFF)
.jpg?fit=fillmax&w=222&bg=FFFFFF)


.jpg?fit=fillmax&w=222&bg=FFFFFF)
