3-Month Treasury
This Curve Threw Us A Curve...
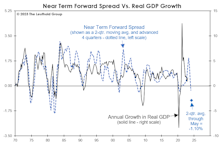
Future economists learning of zero interest rates and Fed balance-sheet expansion during the 2021 inflation surge may wonder if policymakers were “on” something. Jay Powell is clearly “onto” something with his focus on a measure that few are familiar with: the Near-Term Forward Spread (NTFS).
Revisiting The 1966 Forecast Failure
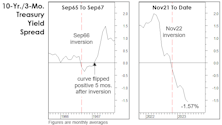
Developments over the last four months leave us even more skeptical that the November yield-curve inversion will join 1966 as a “false positive.” The number one reason being the subsequent shift in the yield curve itself.
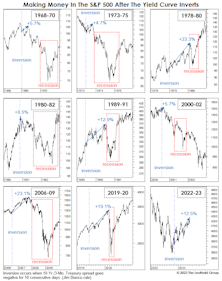
Just A Typical Pre-Recessionary Rally?
Is the stock market disconnected from a souring economy? It might seem that way, and the topic dominated the discussion at the recent Market Technicians Association annual symposium.
The Yield Curve Meets Microsoft Excel
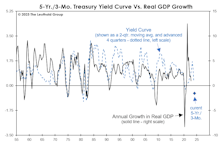
To our surprise, the measure that most closely correlated with real-GDP growth on a one-year time horizon is the rarely mentioned Treasury spread for the 5-Yr./3-Mo.
Which Yield Curve?
Last month’s inversion in the 10-Yr./3-Mo. Treasury spread further tilts an already lopsided scale in favor of a U.S. recession in 2023. That spread has been considered the gold standard from an economic forecasting perspective, and is the basis for the New York Fed’s Recession Probability estimate (which, by the way, should break above its critical 35% threshold when it’s published later this month.)
Rethinking Real Rates
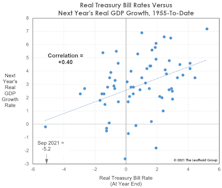
Consumer Price Inflation has stabilized in the 5.2–5.4% range in the last two months, giving the Fed hope that it’s reached a near-term peak. Still, the presence of 5%-plus inflation in the face of ZIRP leaves the real short-term Treasury-bill rate about as deeply negative as it has ever been.
Real Yields: Interesting, But Not So Helpful
After Consumer Price Inflation spiked to a 12 1/2-year high of 4.2% in April, there’s been a torrent of analysis decrying the collapse of “real yields”—including the real Treasury-bond yield, real S&P 500 dividend yield, and even the real S&P 500 earnings yield. Since all of these yields already traded at extremely low nominal levels, the inflation adjustment makes every one of them look even worse. For example, the real yield on 10-year Treasuries just sunk to -2.60%, the lowest reading since 1980 (Chart 1).
Small Caps And The Recent “Rate Hike”
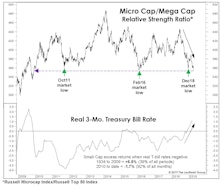
The 1999 leadership parallels we discussed in the latest Green Book remain intact—U.S. over foreign, Growth over Value, and Large over Small. Small Caps have given up most of the “beta bounce” enjoyed in the first two months off the December low, with one Small Cap measure—the Russell Microcap Index (the bottom 1000 of the Russell 2000)—undercutting last year’s relative strength low and those of 2011 and 2016.

.jpg?fit=fillmax&w=222&bg=FFFFFF)
