Inversion
Calibrating The Curve
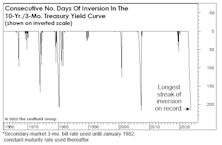
Bloomberg macro strategist, Cameron Crise, noted in early September that the 10-Yr./3-Mo. Treasury-yield spread was set to exceed the old record of consecutive days (217) in negative territory. That threshold, established in 2006-07, was indeed broken on September 7th, and—with the spread still more than 100 basis points—an end to the current inversion episode is hardly on the immediate horizon.
Masquerade Party
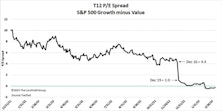
Style investors recently witnessed a rare event when, on February 13th, the P/E ratio of the S&P 500 Growth Index fell below that of the S&P 500 Value Index. At first glance, it is tempting to attribute this valuation flip-flop to the 2022 bear market, which saw Value outperform Growth by a whopping 24.2%. However, the bear-induced collapse of Growth stock prices in 2022 only served to return the P/E spread to a level just below its historical median of 5.1, meaning that the final move toward parity was caused by a force outside the market itself. That “something else” was the S&P 500 style reconstitution that occurs annually on the third Friday of December.
1966-67: When The Yield Curve “Failed”
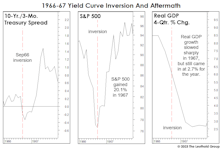
Given the tendency of economists and strategists to dismiss the message of an inverted yield curve, it’s surprising there’s been no scrutiny of the “dog that didn’t bark”—the inversion of 1966. That’s the last time an inverted curve did not lead to a recession.
The Yield Curve And The Problem Of Timing
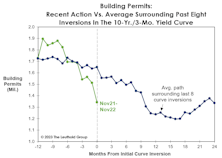
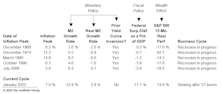
Frequently, there’s money to be made in the stock market in the months following the initial curve inversion. After the inversions of August 2006 and June 2019, the S&P 500 rallied another 23% and 19%, respectively, into its final bull market high. If this cycle plays out in textbook fashion, the business-cycle peak would arrive in September.
A “Curve”-Ball We Didn’t See Coming...

Market veterans know there’s just one thing more probable than a recession after the yield curve inverts: Yield curve denial among a large group of sell-side economists and market strategists! Indeed, the earliest of those dismissals occurred last March—a month before the first of more than a dozen iterations of a yield curve inversion.
The Inversion Before The Inversion
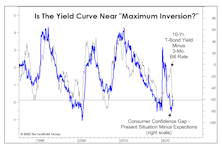
We found the spread between the “Expectations” and “Present Situation” series (the “Confidence Gap”) has historically moved almost in lockstep with the yield curve. As the Confidence Gap plummeted throughout 2021, the implication was the yield curve would soon follow. After some initial resistance, it did.
Which Yield Curve?
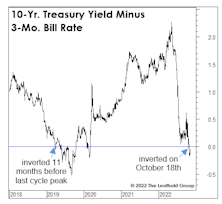
Last month’s inversion in the 10-Yr./3-Mo. Treasury spread further tilts an already lopsided scale in favor of a U.S. recession in 2023. That spread has been considered the gold standard from an economic forecasting perspective, and is the basis for the New York Fed’s Recession Probability estimate (which, by the way, should break above its critical 35% threshold when it’s published later this month.)
The Yield Curve: Two “Perfect Records” At Stake
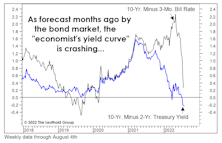
Yield curve action is getting harder to dismiss by the day. But which curve is the most relevant? We tried to answer that question in disciplined fashion in April. To our surprise, the “2s10s” spread that’s ubiquitous in bond-land scored near the bottom of the pack.
Too Early For Curve Watching?

Last month, we published a table showing where we thought a variety of economic and financial-market measures lay along the economic recovery “continuum.” Although the upturn has officially entered just its 22nd month, the bulk of those measures looked “late cycle” in nature.
What “Causes” Inflation To Decline?
Last year’s consensus view that inflation would prove “transitory” missed the mark. There’s no reason for shame; inflation forecasting hadn’t been a required investment skill for the previous 30 years.
Why Is Confidence “Inverted?”

Stimulus and soaring stock prices have contributed to the fastest consumer-confidence rebound of any economic recovery on record. Yet the manner in which this bounce has unfolded is anything but “early cycle.”
Questioning The Monetary Rebound
.jpg?fit=fillmax&w=222&bg=FFFFFF)
This year’s upswing in money-supply growth has been one of many factors that’s prevented our economic work from triggering a recession warning. Following a two-year decline, year-over-year growth in M2 bottomed near 3% late in 2018 and has trended upward all year, reaching 6.7% in the latest week (Chart 1).
More Yield Curve Musings

The U.S. yield curve inversion has lasted long enough that even a few economic optimists now concede it will ultimately prove significant.
More Trends We Don’t Find Friendly…
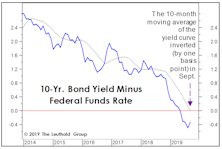
The yield curve’s ten-month moving average inverted in September, hence the yield curve inversion can no longer be dismissed as transitory; the Boom/Bust Indicator remains below its descending 10-month moving average, confirming economic weakness predicted by the yield curve; and, the “Present Situation” component of September’s Consumer Confidence survey slipped below its 10-month moving average for the third time in 2019.
Inveighing Against The Inversion

Some recent headlines are word-for-word regurgitations of those published in response to the early-2006 yield curve inversion. In that case, the naysayers were temporarily correct, as both the U.S. economy and stock market pushed higher for another year and a half before rolling over.
Perception for the Professional
March 2026 Issue

Featured Articles
Sector Navigator
March 2026 Issue
